TRMM Sees Tropical Cyclone 01B
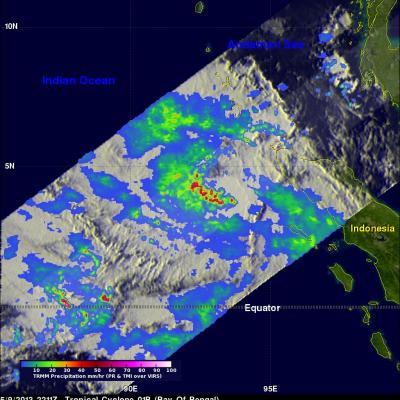
The TRMM satellite passed above a developing tropical cyclone in the northern Indian Ocean west of Indonesia on May 9, 2013 at 2211 UTC. This image shows that tropical cyclone 01B was already fairly well organized. TRMM's Precipitation Radar (PR) instrument indicated that rainfall was falling at a rate over 178 mm/hr (~5.8 inches) in an area of strong convection in the middle of the forming tropical cyclone. The tropical cyclone is a little unusual because it formed only 4.8 degrees north of the equator. Coriolis force, an artifact of the earth's rotation, is weaker near the equator so