Tropical Storm BEATRIZ Forms Off Mexican Coast
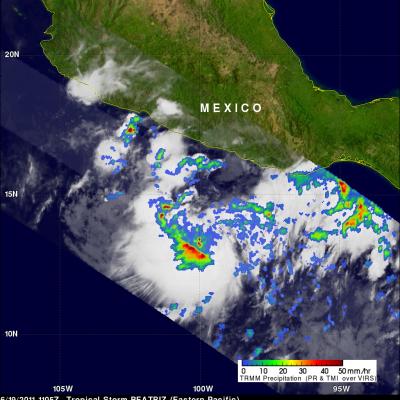
Tropical depression 02E was upgraded to tropical storm Beatriz on 19 June 2011 at 1800 UTC (1100 AM PDT). The TRMM satellite flew over on the same date at 1105 UTC( 0400 AM PDT) obtaining data used in the image shown above. Beatriz was already well organized with TRMM's Microwave Imager (TMI) and Precipitation Radar (PR) data showing that thunderstorms were dropping heavy rainfall in a large area near the center of the forming storm. PR data revealed that some of these powerful storms were reaching heights above 15 km (9.3 miles).