Matmo's Menacing Taiwan
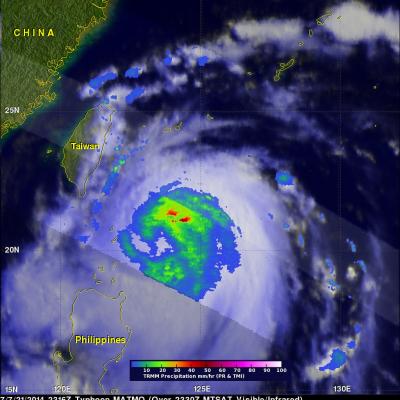
The TRMM satellite saw typhoon Matmo nearing Taiwan on July 21, 2014 at 2316 UTC. TRMM's Microwave Imager (TMI) and Precipitation Radar (PR) showed that Matmo contained a large area of precipitation falling at a rate of over 61 mm (about 2.4 inches) per hour northeast of Matmo's center. After battering Taiwan today, typhoon Matmo is predicted to make a second landfall in China tomorrow.