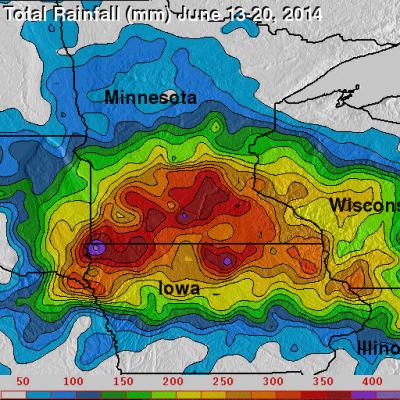
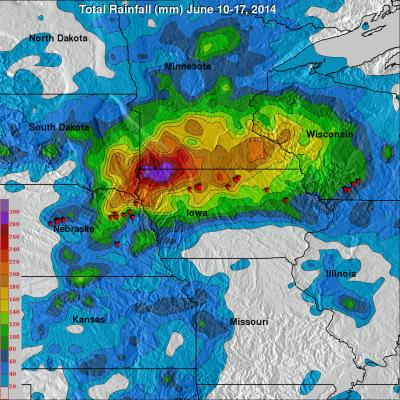
Arthur Becomes First Atlantic Tropical Storm
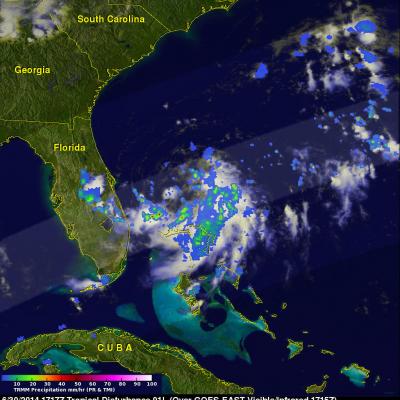
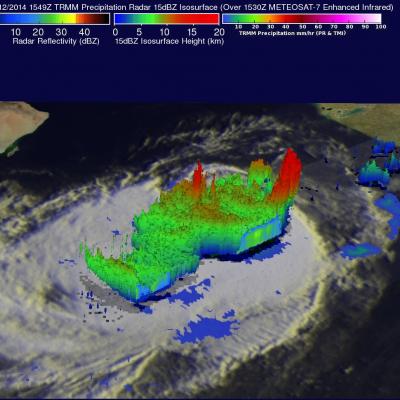
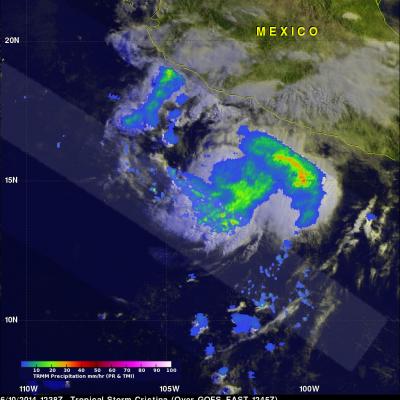
A tropical disturbance east of Florida's coast became better organized and was upgraded to a tropical depression by the National Hurricane Center (NHC) on June 30, 2014 at 11:00 PM EDT (July 1, 2014 at 0300 UTC). On July 1, 2014 at 1100 AM EDT (15:00 UTC) the NHC upgraded tropical depression one to tropical storm Arthur. The TRMM satellite had an excellent view of the forming tropical depression (TD01) on June 30, 2014 at 1717 UTC (1:17 PM EDT). Intense thunderstorms were shown by TRMM to be wrapping around the southern side of the low pressure center. TRMM's Precipitation Radar (PR) revealed