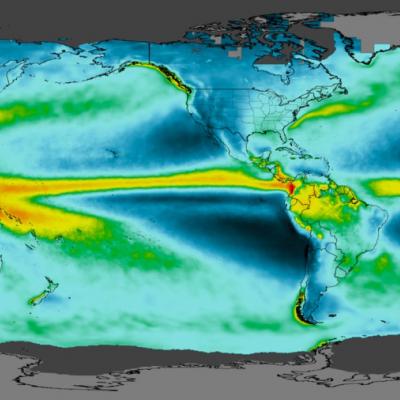
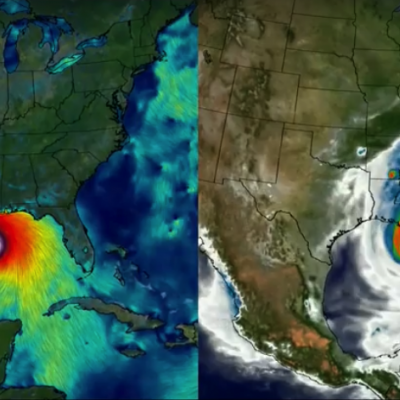
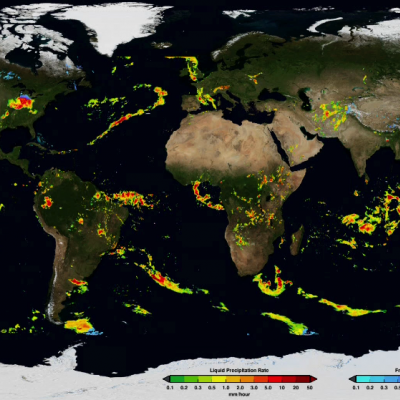
IMERG Early Run Example January 24th, 2020

Data

Precipitation data from the GPM and TRMM missions are made available free to the public in a variety of formats from several sources at NASA Goddard Space Flight Center. This section outlines the different types of data available, the levels of processing, the sources to download the data, and some helpful tips for utilizing precipitation data in your research.

Beginner Resources

Training

Tutorials

Data Visualization

Data FAQ

Learn about IMERG


Frequently Asked Questions

How do I get precipitation data for my specific location?

There are several sources for downloading and viewing data which allow you to subset the data to only include specific parameters and/or geographic locations. These include the GES DISCGiovanni and STORM. In Giovanni you can obtain data for a specific country, U.S. state, or watershed by using the "Show Shapes" option in the "Select Region" pane.

What happened to the TRMM Multi-satellite Precipitation Analysis (TMPA / 3B4x) data products?

The TRMM satellilte has been decommissioned and stopped collecting data in April 2015. The transition from the Tropical Rainfall Measuring Mission (TRMM) data products to the Global Precipitation Measurement (GPM) mission products has completed as of August 2019. The GPM IMERG dataset now includes TRMM-era data from June 2000 to the present, and other TRMM-era data has been reprocessed with GPM-era algorithms and is now available on the GPM FTP servers. TMPA data production ended as of December 31st, 2019 and the TRMMOpen FTP server has been shut down. Historical TMPA data is still available to download from the NASA GES DISC at: https://disc.gsfc.nasa.gov/datasets?keywords=TMPA&page=1

Click here for more details on the transition from TMPA to IMERG. 

Am I allowed to use GPM data for my research?

Yes, in line with NASA's general data policy. Please refer to the GPM Data Policy for further details.

How do I give credit for using GPM data?
Where can I find detailed documentation on the precipitation algorithms?

Browse our directory of GPM & TRMM data products to locate your desired algorithm, then click on the links in the algorithm description under "Documentation". All documentation is also available at the Precipitation Processing System website

What is the spatial and temporal resolution of GPM data?

The resolution of Level 0, 1, and 2 data is determined by the footprint size and observation interval of the sensors involved.  Level 3 products are given a grid spacing that is driven by the typical footprint size of the input data sets.

For our popular multi-satellite GPM IMERG data products, the spatial resolution is 0.1° x 0.1° (or roughly 10km x 10km) with a 30 minute temporal resolution.

Visit the directory of GPM & TRMM data products for details on the resolution of each specific products.

Can I use images or videos from this site or other NASA websites?

For questions about permission for using NASA images and videos, please refer to NASA's official Media Usage Guidelines. For any additional questions please contact bert.ulrich@nasa.gov

Is it possible to subset GPM data?

There are several sources for downloading and viewing data which allow you to subset the data to only include specific parameters and/or geographic locations. These include the GES DISCGiovanni and STORM. In Giovanni you can obtain data for a specific country, U.S. state, or watershed by using the "Show Shapes" option in the "Select Region" pane.

What is the difference between "Near Real-time" (NRT) and "Production" / "Research" data?

GPM data products can be divided into two groups (near real-time and production) depending on how soon they are created after the satellite collects the observations. For applications such as weather, flood, and crop forecasting that need precipitation estimates as soon as possible, near real-time data products are most appropriate.  GPM near real-time (GMI & DPR) products are generally available within a few hours of observation.  For all other applications, production data products are generally the best data sets to use because additional or improved inputs are used to increase accuracy.  These other inputs are only made available several days, or in some cases, several months, after the satellite observations are taken, and the production data sets are computed after all data have arrived, making possible a more careful analysis.

For the GPM IMERG dataset, IMERG Early and Late Runs are the near real-time products, while IMERG Final Run is the research / production product. Click here to learn more about the differences between IMERG Early, Late and Final. 

On 18 October 2024 PPS received a corrupted IR file for 15:00 UTC, which caused all subsequent IR processing to fail and not contribute to the Early Run from 16:00 UTC on 18 October until 05:00 UTC on 20 October, and to the Late Run from 16:00 UTC on 18 October until 20:00 UTC on October 19. Subsequently, PPS manually skipped past the defective IR data file and ran all the IR data that were missed, and then reran both Early and Late for the periods listed above. These rerun products have replaced the earlier products on the fileserver. Please note the out-of-order file times to confirm which...
A server upgrade at the Fleet Numerical Meteorology and Oceanography Center (FNMOC) interrupted real-time transmission of Defense Meteorological Satellite Program (DMSP) data on Sept. 11, 2024, for the F16, F17, and F18 satellites at 18:28, 19:03, and 19:36 UTC, respectively. They returned to real-time operation on Sept. 18 at 23:45 UTC, and are believed to be back-filling the missed data. Thus, the IMERG Final Run products should be unaffected, but the Early and Late Run products will lack SSMIS for this period, with some variation due to latency considerations.
Recently, an error in the metadata of the GeoTIFF files for the IMERG V07B Final Run climatologies has been discovered. This error affected only the geolocation, specifically the orientation, of the fields and not the precipitation data. These files have been replaced with ones containing the correct metadata. Users who have downloaded the old GeoTIFF files should replace them with the new files. These IMERG climatology files are available at https://gpm.nasa.gov/data/imerg/precipitation-climatology
The following is a clarification on the current status of Version 06 and Version 07 IMERG data. Production of V06 Early and Late datasets ceased on 3 June. After overcoming significant hardware, software, and data feed challenges, PPS instituted “Initial Processing” (that is, processing of new data) for Early and Late starting with 00:00 UTC on 1 June. “Retrospective Processing” (that is, processing of the record of previous data) is complete for Early from June 2000 through December 2023. Retrospective Processing is on-going for Late, with parallel runs starting with June 2000 and June 2014...
At 01:45 UTC 12 June, JAXA resumed their processing of GPM radar products, which allowed PPS to catch up the downstream GPM DPR products that they compute, as well as computing the Combined product. Fortunately, through the processing outage the JAXA-NASA data line continued to operate, providing the ancillary data that GPROF and IMERG needed to continue uninterrupted near real-time processing.
Related Articles
IMERG Grand Average Climatology 2001 - 2019
A new data product merges data from the Tropical Rainfall Measuring Mission (TRMM) and the Global Precipitation Measurement (GPM) mission, giving meteorologists and researchers access to a 20-year precipitation record. How much rain and snow fall on Earth in any given year? NASA scientists are answering this question more accurately than ever before and observing precipitation in the most remote places on Earth. And it’s all thanks to an international constellation of satellites. At any given time, instruments onboard about a dozen satellites contribute to a record of the world’s rain and snow
Using the IMERG Long-term Precipitation Data for Applications
A long precipitation data set like the new GPM IMERG V06 product is valuable for many applications and for decision-making. Accurate and reliable precipitation records are not only crucial to understanding trends and variability but also for water management resources and food security, ecological management, and weather, climate and hydrological forecasting. Here we present a few highlights showcasing how GPM IMERG is helping a variety of end users make decisions that will benefit society for years to come. GPM IMERG Data Used for Wind Energy Map of average precipitation in north-central...
Creating Digital Hurricanes
Every day, scientists at NASA work on creating better hurricanes – on a computer screen. At NASA’s Goddard Space Flight Center in Greenbelt, Maryland, a team of scientists spends its days incorporating millions of atmospheric observations, sophisticated graphic tools and lines of computer code to create computer models simulating the weather and climate conditions responsible for hurricanes. Scientists use these models to study the complex environment and structure of tropical storms and hurricanes. Getting the simulations right has huge societal implications, which is why one Goddard...
The Evolution of NASA Precipitation Data
NASA’s global precipitation data and data processing systems have come a long way from the launch of TRMM in 1997 to the ongoing GPM mission. Just before midnight Eastern Daylight Time on June 15, 2015, a fireball appeared over central Africa, streaked across Madagascar, and tracked across the uninhabited Southern Indian Ocean. This was the fiery end of the joint NASA/Japan Aerospace Exploration Agency (JAXA) Tropical Rainfall Measuring Mission (TRMM). TRMM’s homecoming after more than 17 years in orbit also marked the end of the first major satellite mission specifically designed to gather...
GPM's First Global Rainfall and Snowfall Map
The Global Precipitation Measurement mission has produced its first global map of rainfall and snowfall. Like a lead violin tuning an orchestra, the GPM Core Observatory – launched one year ago on Feb. 27, 2014, as a collaboration between NASA and the Japan Aerospace Exploration Agency – acts as the standard to unify precipitation measurements from a network of 12 satellites. The result is NASA's Integrated Multi-satellite Retrievals for GPM data product, called IMERG, which combines all of these data from 12 satellites into a single, seamless map. The map covers more of the globe than any...
GPM's How-to Guide for Global Rain Maps
In a data-processing room at NASA’s Goddard Space Flight Center in Greenbelt, Maryland, racks of high-powered computers are making a set of maps. They're not the familiar satellite map of farms, forests and cities. Instead, the maps will show what's in the atmosphere above the ground -- falling rain and snow. The data come from the Global Precipitation Measurement mission, an international partnership led by NASA and the Japan Aerospace Exploration Agency. The GPM Core Observatory launched on Feb. 27, 2014, and after an initial check-out period, began its prime mission on May 29. The data...
GPM Data from a March 2014 Snostorm
Image Credit: NASA's Goddard Space Flight Center Download this video in HD formats from NASA Goddard's Scientific Visualization Studio The most accurate and comprehensive collection of rain, snowfall and other types of precipitation data ever assembled now is available to the public. This new resource for climate studies, weather forecasting, and other applications is based on observations by the Global Precipitation Measurement (GPM) Core Observatory, a joint mission of NASA and the Japan Aerospace Exploration Agency (JAXA), with contributions from a constellation of international partner...

Hide Body

Hide Date