Images and caption by Hal Pierce (SSAI/NASA GSFC)

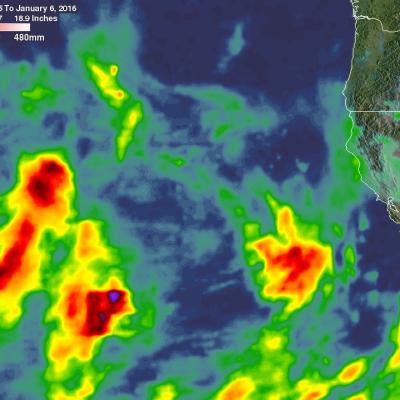
Rainy Weather Over Pacific Northwest Measured From Space

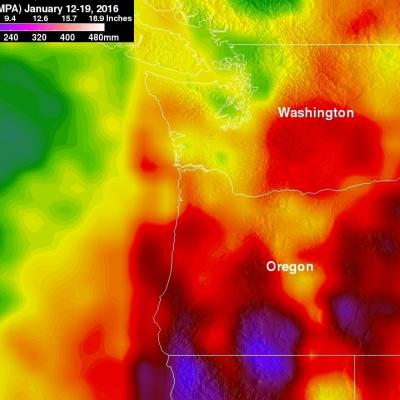
Stormy weather moving in from the Pacific Ocean has frequently affected the Pacific Northwest over the past week. Moisture moving over the Washington and Oregon coasts has been transformed into snow at colder and higher elevations in the Cascades. Coincidentally a field campaign called The Olympic Mountain Experiment (OLYMPEX) is being led by NASA in the Olympic Peninsula of Washington State from November 2015 through February 2016. An analysis of precipitation that occurred in the Pacific Northwest during the period from January 12-19, 2016 is shown here. This precipitation analysis from

GPM Views Atlantic Low Monitored By The National Hurricane Center

A low pressure center located 1100 miles southwest of the Azores has been monitored by the National Hurricane Center (NHC) for possible development into a non-tropical or tropical storm. This low was producing winds of over 52 kts (60 mph). The Atlantic hurricane season runs from June through November so a tropical storm developing this early in the year would be unusual but not unprecented. The GPM core observatory satellite had an excellent daytime look at this area of disturbed weather on January 13, 2016 at 1201 UTC. GPM's Microwave Imager (GMI) and Dual-Frequency Precipitation Radar (DPR)

GPM Spots Hurricane Pali Forming

Tropical storm Pali intensified late yesterday to become the earliest hurricane ever recorded in the Central Pacific Ocean. Warm ocean waters from El Nino supplied the extra energy needed for Pali to develop and prosper so early in the year. The GPM core observatory satellite flew over Pali on January 11, 2015 at 2121Z. GPM's Dual-Frequency Precipitation Radar (DPR) data sliced through Pali clearly showing that an eye had formed. GPM's DPR measured rain falling at a rate of 84.5 mm (3.3 inches) per hour on the eastern side of Pali's forming eye. GPM's radar (DPR Ku Band) peered through Pali's

Powerful Tropical Cyclone Ula Monitored By GPM

Tropical cyclone ULA's winds peaked at 115 kts (132 mph) over the weekend. These high winds meant that for a couple days ULA was a category four tropical cyclone on the Saffir-Simpson Hurricane Wind Scale. ULA moved over the waters of the North Fiji Basin between the Fiji Islands and New Caledonia before moving southeastward into the South Fiji Basin. The GPM core observatory satellite had good looks at powerful tropical cyclone ULA during it's changes in intensity. On January 8, 2015 at 2216 UTC GPM saw that rain was falling at a rate of over 63.5 mm (2.5 inches) north of the intensifying

GPM Catches Tropical Cyclone Ula Rebounding

Tropical cyclone ULA weakened to tropical storm intensity after passing south of and then to the west of the Fiji Islands in the South Pacific. ULA has now started to intensify again while moving to the southeast of New Caledonia. The GPM core observatory satellite passed above tropical cyclone ULA on January 7, 2016 at 1149 UTC when maximum sustained wind speeds were estimated at 45 kts (52 mph). Rain was measured by GPM's Dual-Frequency Precipitation Radar (DPR) instrument falling at a rate of 68 mm (2.7 inches) per hour in storms on ULA's southern side. Some of these convective storms were

NASA's IMERG Looks At El Nino Storms Hitting California

Extreme rain events fueled by the current strong El Nino have started to affect California. A series of storms over the Pacific are shown transporting rain toward the west coast. This estimate of rainfall totals from December 31, 2015 to January 6, 2016 was made using data from NASA's Integrated Multi-satellitE Retrievals for GPM (IMERG). Global precipitation estimates are provided by IMERG through the use of data from satellites in the GPM Constellation and is calibrated with measurements from the GPM Core Observatory as well as rain gauge networks around the world. The National Weather

GPM Sees More Powerful Tropical cyclone 06P (ULA)

The GPM core observatory satellite had an excellent daytime view of tropical cyclone 06P (ULA) on December 30, 2015 at 2358 UTC. The tropical cyclone had moved to the east-southeast of Samoa in the South Pacific Ocean with maximum sustained winds increasing to about 50 kts (58 mph). The rainfall pattern derived from GPM's Microwave Imager (GMI) and Dual-Frequency Precipitation Radar (DPR) instruments showed that 06P was much better organized. Powerful thunderstorms at the center of the tropical cyclone were found by DPR to be dropping rain at a rate of over 66 mm (2.6 inches) per hour. GPM's

Paraguay's Deadly Flooding Rainfall Measured By IMERG

Widespread flooding has recently affected tens of thousands of people in South America. Paraguay has been especially hard hit with the worst flooding in decades occurring after heavy summer rainfall. An estimated 90,000 people have been evacuated from their homes. Storms and flooding caused the deaths of at least six people in Asuncion, Paraguay. The analysis above was generated using the Integrated Multi-satellitE Retrievals for GPM (IMERG) data product. IMERG rainfall estimates are computed in near-realtime. IMERG data indicates that over 350 mm (13.8 inches) of rain fell northeast of

NASA Looks At Deadly Weather Over the US

Heavy rainfall, flooding and tornado outbreaks affected areas of the United States from the Southwest through the Midwest from December 23-27, 2015. Tornadoes and flooding events killed at least 43 people during this period. Fourteen deaths alone occurred with tornadoes that hit Benton, Mississippi on December 23, 2015. Tornadoes are expected in the springtime but are much less frequent during this time of the year. An analysis was made of the rainfall that occurred during the period from December 21-28, 2015. This analysis used data generated by NASA's Integrated Multi-satellitE Retrievals

Typhoon Melor Rainfall Measured By IMERG

Since landfall typhoon Melor has destroyed thousands of homes and caused the deaths of at least six people in the Philippines. Melor had hurricane force during most of the time it spent moving through the central Philippines and weakened to tropical storm intensity only after moving into the South China west of the Luzon. Heavy rainfall from the typhoon also caused some flooding along it's path. An analysis of typhoon Melor's rainfall was made using data from NASA's Integrated Multi-satellitE Retrievals for GPM (IMERG). Total rainfall in the area of typhoon Melor from December 12-16, 2015 is