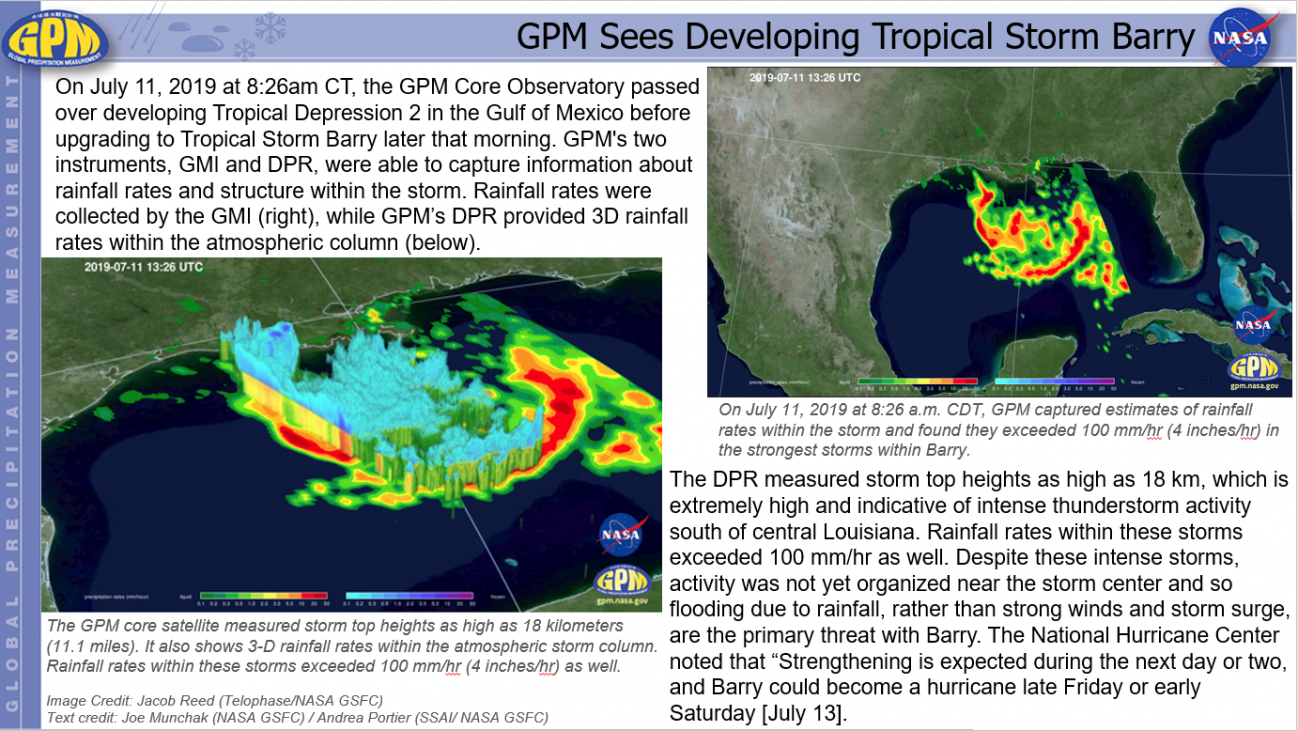
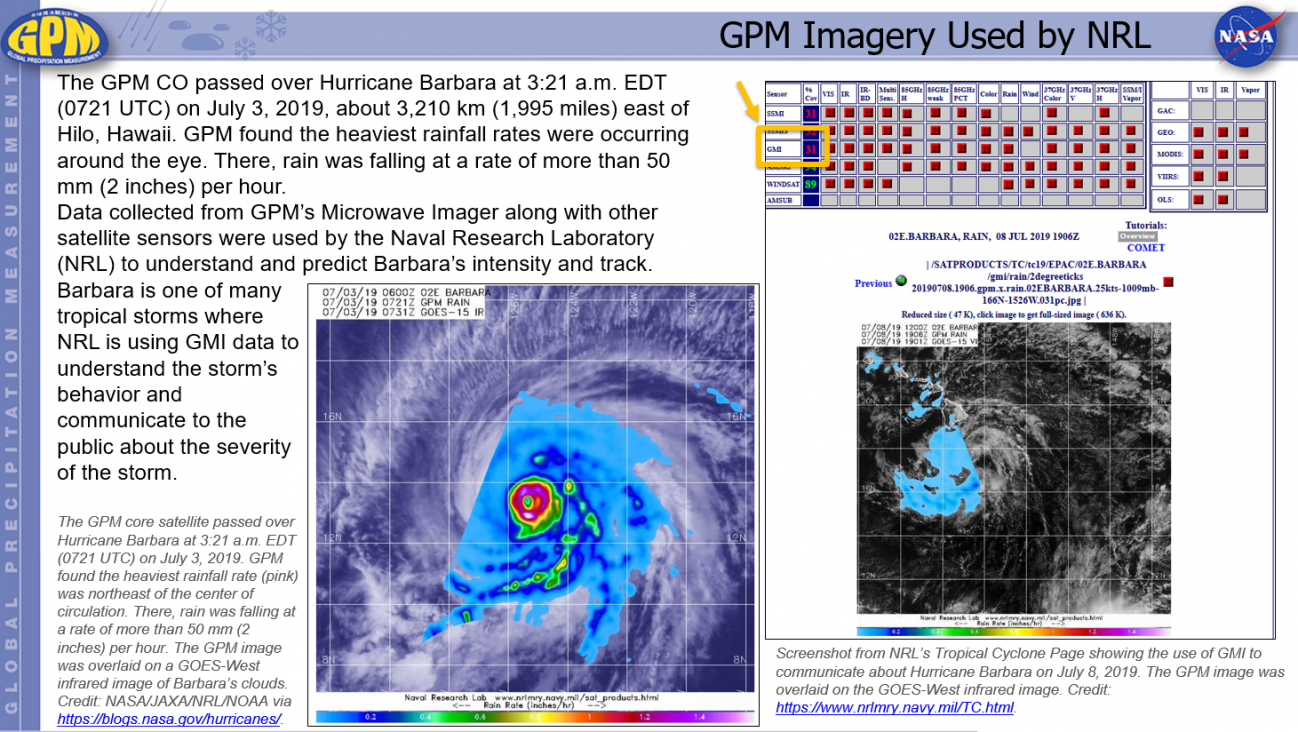
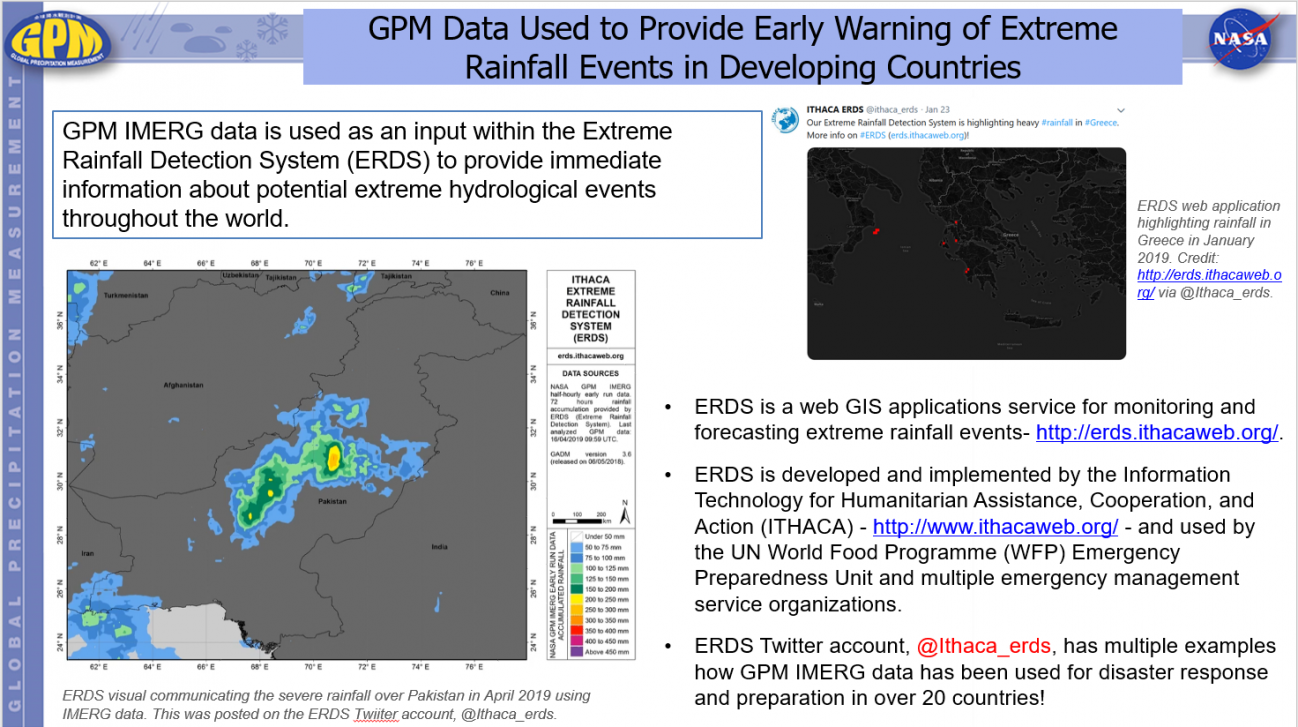
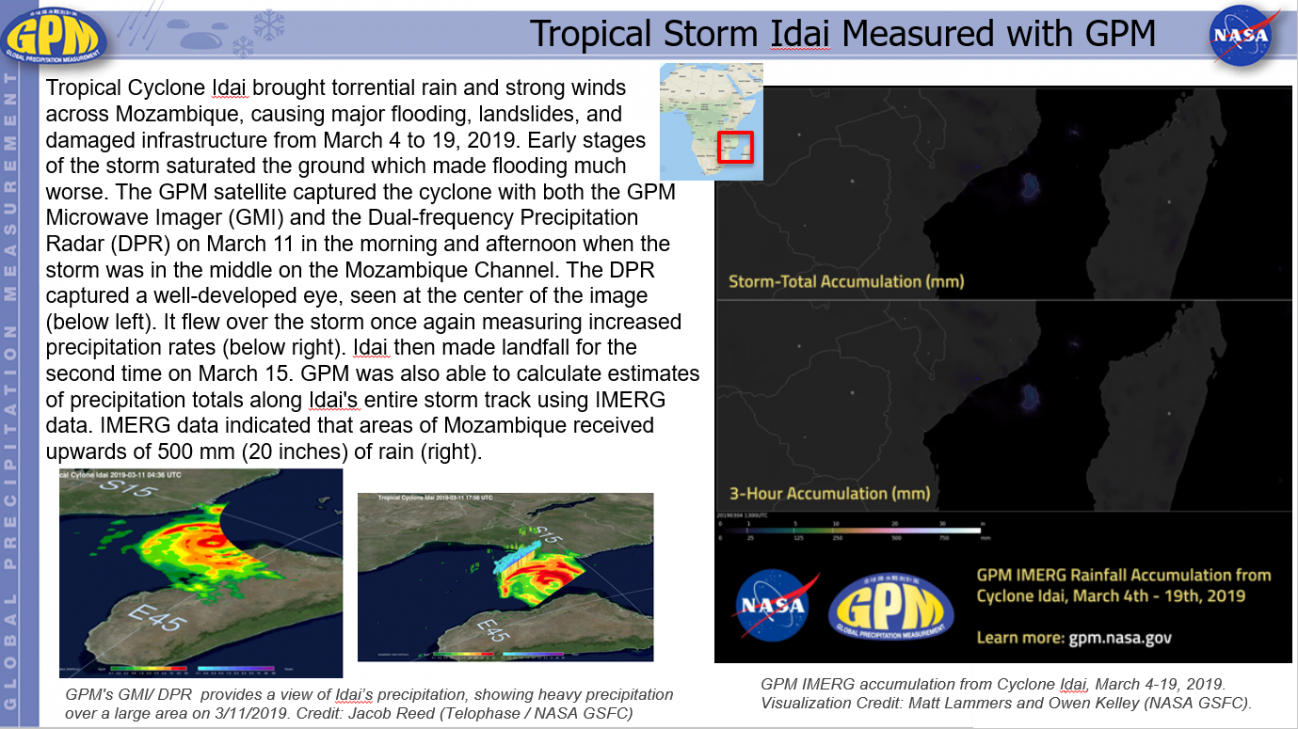
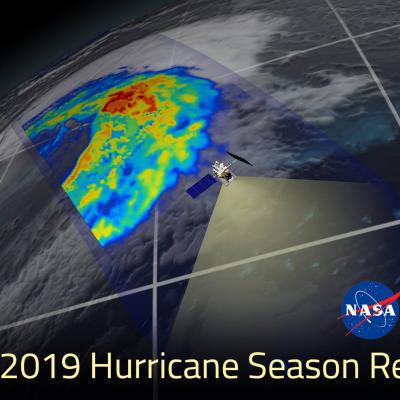
Tropical Cyclones

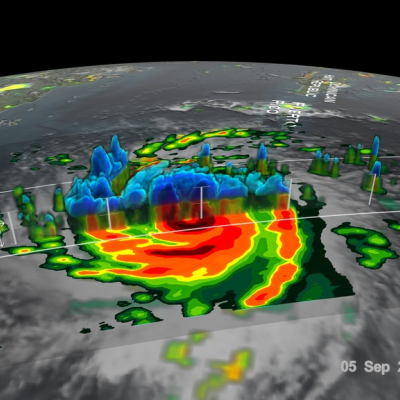
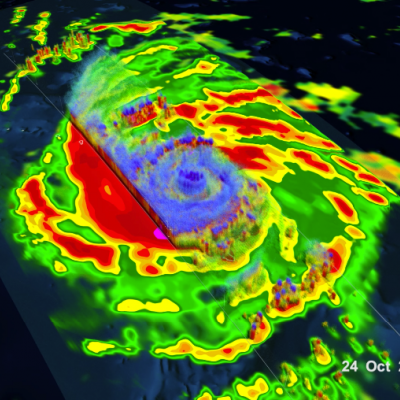
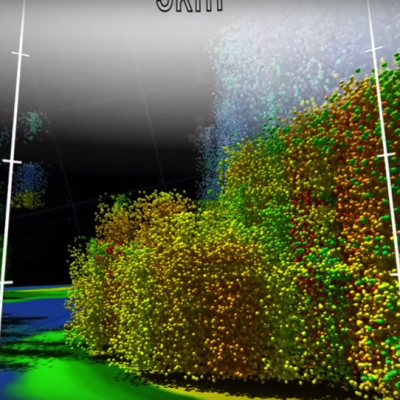
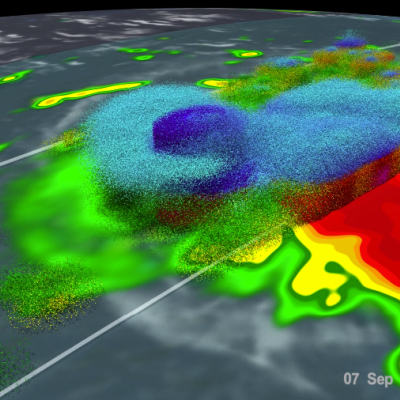
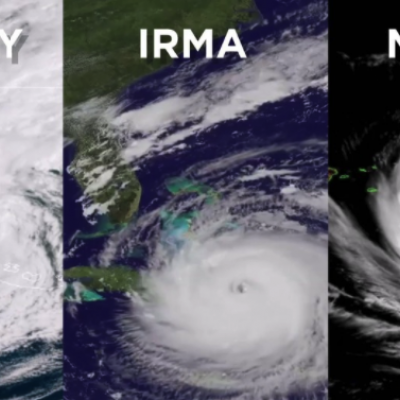
The GPM Mission provides insight into how and why some tropical cyclones intensify and others weaken as they move from tropical to mid-latitude systems. The GPM Core Observatory’s GMI and DPR instruments allow scientists to study the internal structure of storms throughout their life cycle, and view how they change over time.

2019 Hurricane Season Banner
NASA has a unique and important view of hurricanes around the planet. Satellites and aircraft watch as storms form, travel across the ocean and sometimes, make landfall. After the hurricanes have passed, the satellites and aircraft see the aftermath of hurricanes, from downed forests to mass power loss.
Using GPM Data to Understand Hurricanes
The 2019 Atlantic "hurricane season" is officially upon us and runs through November 30th. Did you know that GPM data play a fundamental role in the ability to monitor existing storm activity such as capturing the location and intensity of rainfall inside a storm, as well as improving weather and precipitation forecasts through assimilation of instantaneous precipitation information? Here are a few applications of GPM data used to study hurricanes and how the data was then used for decision-making. Monitoring Irma with GPM This image shows rainfall analysis that was derived from GPM's GMI data...
GPM Catches Typhoon Yutu Making Landfall
NASA's GPM Core observatory satellite captured an image of Super Typhoon Yutu when it flew over the powerful storm just as the center was striking the central Northern Mariana Islands north of Guam. Early Thursday, Oct. 25 local time, Super Typhoon Yutu crossed over the U.S. commonwealth of the Northern Mariana Islands. It was the equivalent of a Category 5 hurricane. The National Weather Service in Guam said it was the strongest storm to hit any part of the U.S. this year. Download this video in high resolution from the NASA Goddard Scientific Visualization Studio Download video without...
Dive Into a 360-View of Hurricane Maria
Two days before Hurricane Maria devastated Puerto Rico, the NASA/JAXA Global Precipitation Measurement Core Observatory satellite captured a 3D view of the 2017 storm. At the time Maria was a category 1 hurricane. The 3-D view reveals the processes inside the hurricane that would fuel the storm’s intensification to a category 5 storm within 24 hours. For the first time in 360 degrees, this data visualization takes you inside the hurricane. The precipitation satellite has an advanced radar that measures both liquid and frozen water. The brightly colored dots show areas of rainfall, where green...
GPM Flies Over Tropical Cyclone Florence
Download in High Resolution from the NASA Goddard Scientific Visualization Studio GPM passed over Tropical Storm Florence on September 7, 2018. As the camera moves in on the storm, DPR's volumetric view of the storm is revealed. A slicing plane moves across the volume to display precipitation rates throughout the storm. Shades of green to red represent liquid precipitation. Frozen precipitation is shown in cyan and purple. NASA's Global Precipitation Measurement mission or GPM core observatory satellite flew over Tropical Storm Florence on September 7, 2018. At that time, the storm was...
Intense Hurricanes Seen From Space
In 2017, we have seen four Atlantic storms rapidly intensify with three of those storms - Hurricane Harvey, Irma and Maria - making landfall. When hurricanes intensify a large amount in a short period, scientists call this process rapid intensification. This is the hardest aspect of a storm to forecast and it can be most critical to people's lives. While any hurricane can threaten lives and cause damage with storm surges, floods, and extreme winds, a rapidly intensifying hurricane can greatly increase these risks while giving populations limited time to prepare and evacuate.