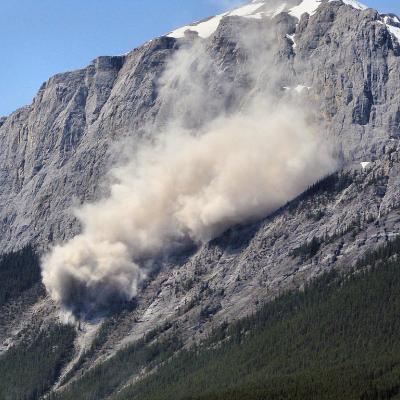
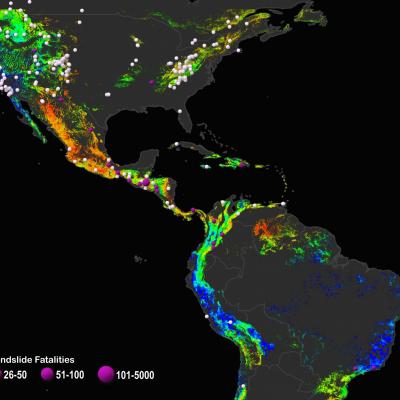
Logo for GPM Applications showing ecology, water and agriculture, energy, disasters, health, and weather.

Applications Articles

GPM Sees Powerful Winter Storm Grayson
Powerful Coastal Storm Brings Snow, Extreme Cold, Wind and Blizzard Conditions to the East Coast View an interactive 3D visualization of GPM data from Winter Storm Grayson in STORM Event Viewer Mobile version Cold Artic air has been keeping the vast majority of the country east of the Rockies in the deep freeze over the past week. Now a powerful coastal storm is working its way up the East Coast bringing a mixture of snow, freezing rain, high winds and blizzard conditions from as far south as Florida all the way up into Maine with blizzard warnings in effect along the coast from North Carolina...
GPM Catches Hurricane Nate's Landfall
NASA's GPM satellite helped track Nate's progress through the Gulf of Mexico and also captured Nate's landfall on the north central Gulf Coast. This animation shows instantaneous rainrate estimates from NASA's Integrated Multi-satellitE Retrievals for GPM or IMERG product over North America and the surrounding waters beginning on Thursday October 5th when Nate first became a tropical storm near the northeast coast of Nicaragua in the western Caribbean until its eventual landfall on the northern Gulf Coast on Sunday October 8th.
Intense Hurricanes Seen From Space
In 2017, we have seen four Atlantic storms rapidly intensify with three of those storms - Hurricane Harvey, Irma and Maria - making landfall. When hurricanes intensify a large amount in a short period, scientists call this process rapid intensification. This is the hardest aspect of a storm to forecast and it can be most critical to people's lives. While any hurricane can threaten lives and cause damage with storm surges, floods, and extreme winds, a rapidly intensifying hurricane can greatly increase these risks while giving populations limited time to prepare and evacuate.
GPM Sees Hurricanes Maria and Jose
GPM passed over both Hurricane Maria and Hurricane Jose on September 18th, 2017. As the camera moves in on the Maria, DPR's volumetric view of the storm is revealed. A slicing plane moves across the volume to display precipitation rates throughout the storm. Shades of green to red represent liquid precipitation extending down to the ground. The Global Precipitation Measurement (GPM) mission shows the rainfall distribution for two major storms churning in the Atlantic and Caribbean basins. The visualization shows Hurricane Jose as it continues to slowly move northward off the US East Coast east...
Using NASA Satellite Data to Predict Malaria Outbreaks
In the Peruvian Amazon, the Anopheles darlingi mosquito is most responsible for spreading malaria. With funding from NASA's Applied Sciences Program, scientists are turning to the agency’s fleet of Earth-observing satellites to develop a system that uses satellite and other data to help forecast malaria outbreaks at the household level months in advance and prevent them from happening. Credits: NASA's Goddard Space Flight Center / Joy Ng In the Amazon Rainforest, few animals are as dangerous to humans as mosquitos that transmit malaria. The tropical disease can bring on high fever, headaches...
GPM Examines Hurricane Irma
The GPM core observatory satellite had an exceptional view of hurricane Irma's eye when it flew above it on September 5, 2017 at 12:52 PM AST (1652 UTC). This visualization shows a rainfall analysis that was derived from GPM's Microwave Imager (GMI) and Dual-Frequency Precipitation Radar (DPR) data. Irma was approaching the Leeward Islands with maximum sustained winds of about 178 mph (155 kts). This made Irma a dangerous category five hurricane on the Saffir-Simpson hurricane wind scale. Intense rainfall is shown within Irma's nearly circular eye. This 3-D cross-section through Irma's eye was...
Hurricane Irma's Heat Engine Exposed
At 1 PM EDT (1700 UTC) on September 5, 2017, the radar on the Global Precipitation Measuring Mission (GPM) satellite captured this 3D view of the heat engine inside of category-5 Hurricane Irma. Under the central ring of clouds that circles the eye, water that had evaporated from the ocean surface condenses, releases heat, and powers the circling winds of the hurricane. The radar on the GPM satellite is able to estimate how much water is falling as precipitation inside of the hurricane, which serves as a guide to how much energy is being released inside the hurricane's central "heat engine."...
GPM Captures Hurricane Harvey's Rainfall
Music: "Whirlpool," Michael Jan Levine, Killer Tracks The Global Precipitation Measurement (GPM) Core Observatory captured these images of Hurricane Harvey at 11:45 UTC and 21:25 UTC on the 27th of August nearly two days after the storm made landfall as it was meandering slowly southeast at just 2 mph (~4 kph) near Victoria, Texas west of Houston. The image shows rain rates derived from GPM's GMI microwave imager (outer swath) and dual-frequency precipitation radar or DPR (inner swath) overlaid on enhanced visible/infrared data from the GOES-East satellite. Harvey's cyclonic circulation is...
Harvey Hits Texas, Unleashes Major Flooding
Despite its earlier demise, after rejuvinating over the warm waters of the Gulf of Mexico, Hurricane Harvey has become a major weather maker as it unleashes historical flooding over parts of coastal Texas. Harvey began on the 17th of August as a weak tropical storm about 250 miles (~400 km) east of Barbados in the Leeward Islands. Over the next two days, Harvey continued moving steadily westward passing through the Leeward Islands as a still weak tropical storm and entered into the east central Caribbean. On the 19th, Harvey succumbed to the effects of northeasterly wind shear over the central...
GPM Catches Nor'easter over New England
At the time of the Global Precipitation Measurement (GPM) Core Observatory overpass (April 1, 2017, 0550 UTC), the storm's center of low pressure was south of Long Island. At the mid-levels of the atmosphere, the circulation was centered over northeast Pennsylvania. This led to a classic overrunning, warm conveyor setup, which happened when the counterclockwise low level flow drew in cold air out of the north/northeast (hence "Nor'easter") from Canada. Higher up, warm and moist air from further south was lifted over this cold air and resulted in precipitation in the form of snow at the surface...

Hide Date