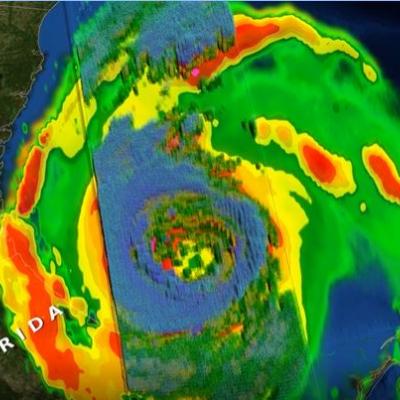
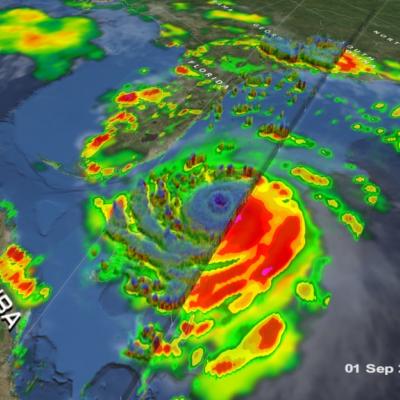
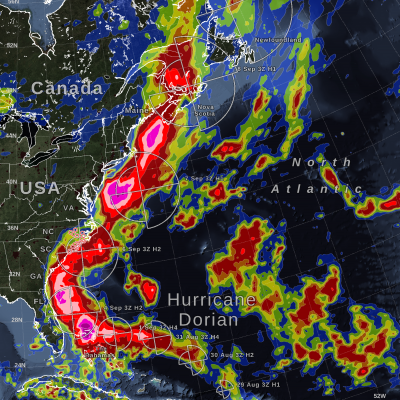
Logo for GPM Applications showing ecology, water and agriculture, energy, disasters, health, and weather.

Applications Articles

GPM Examines Hurricane Irma
The GPM core observatory satellite had an exceptional view of hurricane Irma's eye when it flew above it on September 5, 2017 at 12:52 PM AST (1652 UTC). This visualization shows a rainfall analysis that was derived from GPM's Microwave Imager (GMI) and Dual-Frequency Precipitation Radar (DPR) data. Irma was approaching the Leeward Islands with maximum sustained winds of about 178 mph (155 kts). This made Irma a dangerous category five hurricane on the Saffir-Simpson hurricane wind scale. Intense rainfall is shown within Irma's nearly circular eye. This 3-D cross-section through Irma's eye was...
Hurricane Irma's Heat Engine Exposed
At 1 PM EDT (1700 UTC) on September 5, 2017, the radar on the Global Precipitation Measuring Mission (GPM) satellite captured this 3D view of the heat engine inside of category-5 Hurricane Irma. Under the central ring of clouds that circles the eye, water that had evaporated from the ocean surface condenses, releases heat, and powers the circling winds of the hurricane. The radar on the GPM satellite is able to estimate how much water is falling as precipitation inside of the hurricane, which serves as a guide to how much energy is being released inside the hurricane's central "heat engine."...
GPM Captures Hurricane Harvey's Rainfall
Music: "Whirlpool," Michael Jan Levine, Killer Tracks The Global Precipitation Measurement (GPM) Core Observatory captured these images of Hurricane Harvey at 11:45 UTC and 21:25 UTC on the 27th of August nearly two days after the storm made landfall as it was meandering slowly southeast at just 2 mph (~4 kph) near Victoria, Texas west of Houston. The image shows rain rates derived from GPM's GMI microwave imager (outer swath) and dual-frequency precipitation radar or DPR (inner swath) overlaid on enhanced visible/infrared data from the GOES-East satellite. Harvey's cyclonic circulation is...
Harvey Hits Texas, Unleashes Major Flooding
Despite its earlier demise, after rejuvinating over the warm waters of the Gulf of Mexico, Hurricane Harvey has become a major weather maker as it unleashes historical flooding over parts of coastal Texas. Harvey began on the 17th of August as a weak tropical storm about 250 miles (~400 km) east of Barbados in the Leeward Islands. Over the next two days, Harvey continued moving steadily westward passing through the Leeward Islands as a still weak tropical storm and entered into the east central Caribbean. On the 19th, Harvey succumbed to the effects of northeasterly wind shear over the central...
GPM Catches Nor'easter over New England
At the time of the Global Precipitation Measurement (GPM) Core Observatory overpass (April 1, 2017, 0550 UTC), the storm's center of low pressure was south of Long Island. At the mid-levels of the atmosphere, the circulation was centered over northeast Pennsylvania. This led to a classic overrunning, warm conveyor setup, which happened when the counterclockwise low level flow drew in cold air out of the north/northeast (hence "Nor'easter") from Canada. Higher up, warm and moist air from further south was lifted over this cold air and resulted in precipitation in the form of snow at the surface...
GPM Measures Tropical Cyclone Debbie
Tropical cyclone Debbie formed in the Coral Sea northeast of Australia om March 24, 2017. Debbie intensified and had hurricane force wind speeds within a day of formation. While headed toward northeastern Australia Debbie reached it's maximum sustained wind speeds estimated at over 100 kts (115 mph) on March 27, 2017 (UTC). Tropical cyclone Debbie came ashore on March 28th and brought destructive winds and extremely heavy rain to northeastern Australia. It was reported that heavy rainfall caused flash flooding that cut off a coastal town and covered several roads in Queensland. The GPM...
Another Pineapple Express Brings More Rain, Flooding to California
The West Coast is once again feeling the effects of the "Pineapple Express". Back in early January one of these "atmospheric river" events, which taps into tropical moisture from as far away as the Hawaiian Islands, brought heavy rains from Washington and Oregon all the way down to southern California. This second time around, many of those same areas were hit again. The current rains are a result of 3 separate surges of moisture impacting the the West Coast. The first such surge in this current event began impacting the Pacific coastal regions of Washington, Oregon, and northern California on...
GPM Sees Hurricane Matthew Nearing Florida
UPDATE 10/6/16: NASA's Global Precipitation Measurement mission or GPM core observatory satellite flew over Hurricane Matthew several times as the category 4 storm headed toward Florida. The GPM Core Observatory carries two instruments that show the location and intensity of rain and snow, which defines a crucial part of the storm structure – and how it will behave. The GPM Microwave Imager sees through the tops of clouds to observe how much and where precipitation occurs, and the Dual-frequency Precipitation Radar observes precise details of precipitation in 3-dimensions. This data...
GPM Provides a Closer Look at the Louisiana Floods
Twice on August 12, 2016 GPM flew over a massive rainstorm that flooded large portions of Louisiana. The flooding was some of the worst ever in the state, resulting in a state of emergency. Tens of thousands of people were evacuated from their homes in the wake of this unprecedented event. Throughout the course of August 12 (UTC) GPM captured the internal structure of the storm twice and GPM IMERG measured the rainfall accumulation on the ground. NASA's GPM satellite is designed to measure rainfall using both passive microwave (GMI) and radar (DPR) instruments. DPR can observe 3D structures of...
NASA Sees Hermine's Twin Towers
In order for Hermine or any other tropical depression, to intensify there must be a pathway for heat energy from the ocean surface to enter the atmosphere. For Hermine, the conduit may have been one of the two "hot towers" that the Global Precipitation Measurement mission or GPM core satellite observed on Aug. 31 at 4:09 p.m. EDT (2009 UTC). GPM's DPR instrument saw strong storms near the center of Tropical Depression Hermine on the evening of Aug. 31. Two "hot towers" are seen to the right of the low pressure center (south and east of the center), which are labeled "T1" and "T2." The "L"...

Hide Date