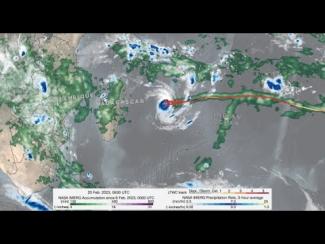


GPM IMERG Measures Rainfall from Tropical Storm Cristobal
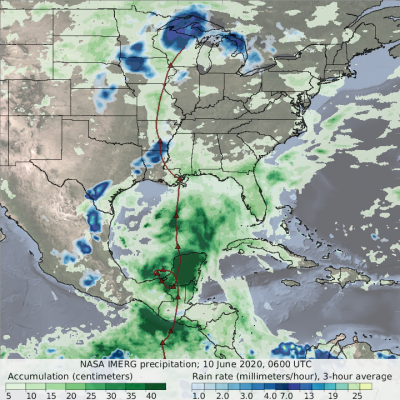
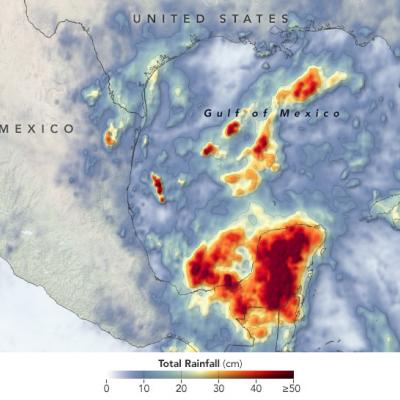
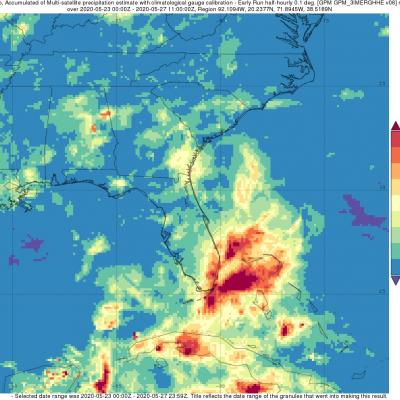
This animation shows NASA IMERG rain rates (blue shading) and accumulations (green shading) alongside the NOAA low-pressure center track (red line) of Tropical Storm Amanda/Cristobal. The origin of this storm was in the eastern Pacific Ocean in late May 2020, where it was named Tropical Storm Amanda as it approached the southern Mexican and Central American coast. Amanda made landfall in Guatemala on May 31, where it began to deliver the first of a series of heavy rain pulses that led to flooding in the region. After temporarily stalling over land, the system reformed over the Bay of Campeche on June 1 as Tropical Storm Cristobal and made its second landfall on June 3 in Mexico. The storm continued to deliver several pulses of heavy rainfall to southern Mexico, Guatemala, and El Salvador. Some areas of the region accumulated over 60 cm (~2 feet) of rainfall throughout Cristobal's passage. The storm then crossed the Gulf of Mexico and made landfall in Louisiana on June 7 and progressed northward as a tropical depression before being classified as an extratropical low pressure system over Wisconsin on June 10. Large swaths of the U.S. Gulf Coast and Midwest as far north as Wisconsin saw accumulations in excess of 10 cm (~4 inches), and some areas along the coasts of Florida, Alabama, and Mississippi received over 20 cm (~8 inches), during Cristobal’s passage.