


Remnants Of Post Tropical Storm Julia Checked By GPM
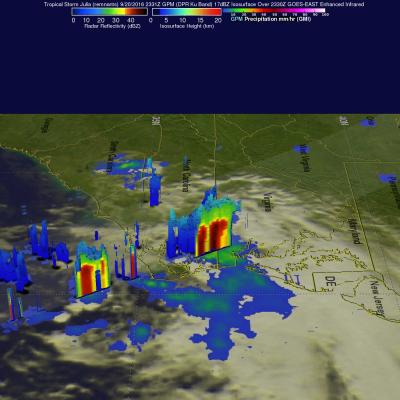
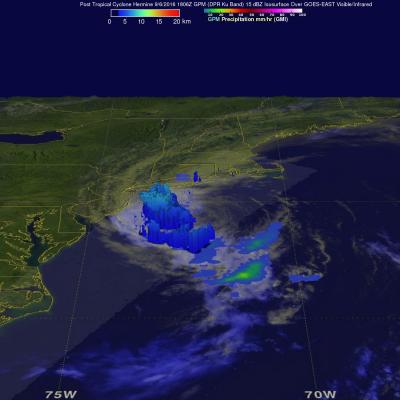
The National Hurricane Center (NHC) issued the last advisory on post tropical storm Julia on September 19, 2016 but the remnants have persisted off the Southeast coast. The remnants of the low are interacting with a slow moving frontal system and are now dropping rain over eastern North Carolina and Virginia. The GPM core observatory satellite flew over this area on Tuesday September 20, 2016 at 7:31 PM EDT (2331 UTC). The satellite's Microwave Imager (GMI) and Dual-Frequency Precipitation Radar (DPR) instruments showed the location and intensity of heavy rainfall within this area of low