GPM Applications Banner: Disasters

Using GPM Data for Disasters and Risk Management

Too much or too little rainfall can have significant impacts on populations around the world. As population and global temperatures increase, it is crucial to understand what locations will become more vulnerable to extreme rainfall and drought and the subsequent natural hazards (e.g., landslides) and risks (e.g., lose of property) they impose. Satellites allow us to monitor changes in the precipitation, especially over oceans and regions where ground-based data are sparse. With its near-real-time precipitation estimates and near global coverage, GPM serves as an essential tool for assessing risk and planning disaster response and recovery.  For example, near-real-time precipitation data from GPM are used within various models to help monitor and predict the path and intensity of tropical storms, vegetation fire starting and spreading, and landslide activity across the globe. The Disasters and Risk Management applications area seeks to use the GPM precipitation satellite data to improve forecasting, preparation, response, recovery, mitigation and insurance of natural hazards including tropical cyclones, floods, droughts, wildfires, landslides, and other extreme weather events.

Overview

Sections

GPM Data for Decision Making

Image

GPM's GMI / DPR provides views of hurricane Lane’s precipitation, showing intense storms near the center on August 19, 2018. Credit: Hal Pierce (SSAI/NASA GSFC).


The GPM Mission provides insight into how and why some tropical cyclones intensify and others weaken as they move from tropical to mid-latitude systems. The GPM Core Observatory’s GMI and DPR instruments allow scientists to study the internal structure of storms throughout their life cycle, and view how they change over time. Specifically, the GMI has the capability to measure the amount, size, intensity, and type of precipitation, from heavy-to moderate rain to light rain and snowfall. The DPR returns three-dimensional profiles and intensities of liquid and solid precipitation, revealing the internal structure of storms within and below clouds. Scientists use these instruments to track tropical cyclones and forecast their progression and to verify their tropical cyclone computer models. They also use instrument data to understand the distribution and movement of latent heat throughout the storm, particularly in the development of hot towers in the wall of clouds around the eye, which have been linked to rapid intensification. Together, these instruments will improve hurricane tracking and forecasts, which can help decision makers save lives.

View tropical cyclones articles

Image

Submerged Houston neighborhoods in the wake of Tropical Storm Harvey on August 29, 2017. Credit: Marcus Yam / Getty Images

To better understand and predict floods scientists have developed hydrological models based on how much rainfall occurs and where the water will likely go once it hits the ground. They use several satellite precipitation datasets within these models to provide near real-time estimates of when and where areas may flood on local, regional, and global scales. GPM provides frequent precipitation observations with near global coverage, of which 80% are less than 3 hours apart, exceeding the minimum deemed necessary for hydrometeorological applications. Therefore, rainfall data measured by the GPM Mission and its products, like the Integrated Multi-satellitE Retrievals for GPM (IMERG) data product, helps us better understand how changing precipitation patterns at multiple scales translates changes into hydrologic fluxes and states that can be used for flood detection and warning systems.

View floods articles

Image

Aerial view of landslide that buried Colonia las Colinas, El Salvador. Credit: USGS

Landslides are one of the most pervasive hazards in the world, resulting in more fatalities and economic damage than is generally recognized. Saturating the soil on vulnerable slopes, intense and prolonged rainfall is the most frequent landslide trigger, but seismicity, river undercutting, freeze-thaw processes, and human activity can also cause extensive and devastating landslides. Understanding where and when landslides have occurred in the past and where they may occur in the future is extremely challenging because of the lack of ground-based sensors at the landslide site to provide both triggering information (e.g. rainfall intensity and duration), and the timing and extent of the mass movement events. Precipitation measurements from remote sensing allows us to gain new insight to identify landslide activity, characterize the triggering patterns of these events spatially and temporally, assess the surface conditions for potential activity, and support the full cycle of disaster risk assessment. In particular, GPM’s more frequent and more detailed coverage of precipitation across the globe can help improve landslide model accuracy and expand potential landslide forecasting capabilities.

Learn more about GPM applications for landslides

Image

High severity fire in the western U.S. Credit: USDA Forest Service

Wildfires play an integral role in maintaining ecosystem biodiversity and structure.  Wildfires, which include any non-structure fire that occurs in vegetation or natural fuels, is an essential process that connects terrestrial systems to the atmosphere and climate.  However, the effects of fire can be disastrous, both immediately (e.g., poor air quality, loss of life and property) and through post-fire impacts (floods, debris flows/landslides, poor water quality). Wildfires can be triggered by several factors including lightning, high winds, drought, and people. 

There are several ongoing activities using remote sensing data to support pre-, active- and post-fire research, as well as the applicable use of these data and products in support of management decisions and strategies, policy planning and in setting rules and regulations. Frequent precipitation measurements from GPM along with temperature and land cover measurements from other satellites can provide key information to determine the overall dryness of an area and the potential start and spread of a vegetation fire. 

View wildfires articles
 

Image

GPM's GMI and DPR observe rainfall accumulation over the storm and 3-D vertical structure in a line of intense storms associated with the mesoscale convection system over northern New Mexico and Oklahoma on June 25, 2018. Credit: Hal Pierce (SSAI/NASA GSFC)


Many regions in the world experience severe weather such as thunderstorms, hail, tornadoes, and blizzards every year. Severe weather usually comes with heavy precipitation and causes unexpected hydrometeorological hazards, such as floods or landslides, which can affect thousands of people, posing a threat on life and property. Therefore, it is critically important to monitor severe weather and estimate heavy precipitation so that the occurrence and intensity of associated hydrometeorological hazards can be well identified, detected, and forecasted. Where ground-based instruments are sparse, remote sensing systems can be especially useful to observe and monitor these extreme events. Microwave sensors used by the GPM Mission allows scientists to map thunderstorm cores to gain insight into storm structures and mesoscale dynamics (e.g. thunderstorms to hurricanes) as well as detect light rain to moderate-to heavy rain and snowfall. Delivery of precipitation data from the GPM Mission is crucial for operational and research organizations to advance precipitation measurement science to improve weather forecasting that can subsequently benefit society for years to come. 

View severe weather articles


Image

Coast Guardsmen use a boat to assist residents during severe flooding around Baton Rouge, LA on August 14, 2016. Credit: Petty Officer 3rd Class Brandon Giles/Coast Guard

Every year, landslides wipe out roads or town, devastating floods put city blocks underwater, or a violent hurricane devastates the coastal communities. Natural hazards, like Hurricane Maria or flooding in Houston, have huge impacts on people around the world. Heavy rains and large storm systems are often significant factors that cause these disasters to have huge economic costs or even kill people. The best defense against natural hazards is accurate and early warning systems. Understanding the timing, location, and intensity of precipitation extremes using GPM data, organizations that handle disaster response and recovery can monitor, assess, and understand the damage or potential damage of a disaster. These efforts help to minimize the impact of a natural disaster as well as effectively coordinate with organizations and the public before, during, after so as many people are safe and needs are met. 

Image

A house on the Jersey Shore submerged in water in the aftermath of Hurricane Sandy.  Credit: Jim Greenhill via BU Today

The insurance and disaster management industries are closely related; dealing with the risk of natural disaster and managing the events following disasters. Reinsurance companies work to understand the need of its potential customers and the risks to which they may be exposed.  A companies’ success is generally tied to the ability to forecast the probability of natural hazards, including storms, floods, and landslides. Earth Science data and information derived from remote sensing instruments over the last decade have made it more feasible to develop climate records and understand region’s susceptibility to a natural disaster. Such data are then used to design payout triggers when natural hazards occurs. Policyholders are then compensated according to the strength of the measured event against those triggers. Specially, reinsurance companies across the world use rainfall data from GPM to develop rainfall thresholds to design insurance payouts when disasters strike. 

Disasters Featured Resources

Jump to a Year

2022 | 2021 | 2020 | 2019 | 2018

2017 | 2016 | 2015 | 2014 | 2013

2012 | 2011 | 2010 | 2009 | 2008

2007 | 2006 | 2005 | 2004 | 2003

2002

GPM Says Goodbye to Tropical Storm Molave

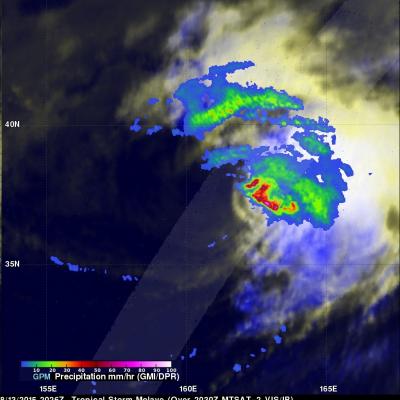
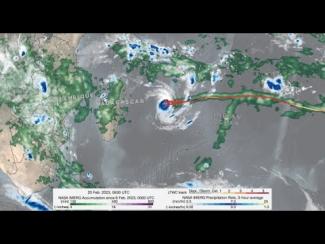
Tropical storm Molave became the 16th named tropical cyclone when it formed on August 7, 2015 and spent the past week over the open waters of the Pacific Ocean. For a few days Molave moved toward Japan but re-curved toward the northeast and passed well to the southeast of Japan. Molave became an extratropical cyclone and the Joint Typhoon Warning Center (JTWC) issued it's last warning on August 13, 2015 at 2100 UTC. Molave was last seen as a tropical storm by the GPM core observatory satellite on August 13, 2015 at 2026 UTC. Molave's rainfall intensity was measured with this satellite pass by

Hurricane Hilda Weakening, Heads Toward Hawaii

Three days ago Hilda was a category four hurricane on the Saffir-Simpson Hurricane Wind Scale with winds of 120 kts (138 mph). Hilda has been weakening and had winds of about 80 kts (92 mph) when the GPM core observatory satellite passed above on August 11, 2015 at 0411 UTC (August 10, 2015 at 6:11 PM HST). Rainfall data from GPM's Microwave Imager (GMI) instrument is shown overlaid on a 0400 UTC August 11, 2015 GOES-WEST Infrared image. GPM's GMI revealed that storms north of hurricane Hilda's eye were dropping rain at a rate of over 53.6 mm (2.2 inches) per hour. Hilda's future positions

Deadly Typhoon Soudelor's Rainfall Analyzed

Soudelor formed in the middle of the Pacific Ocean well east of Guam on July 20, 2015. Soudelor became more powerful with peak intensity of about 155 kts (178 mph) reached on August 3, 2015 when the super typhoon was well east of Taiwan over the open waters of the Pacific Ocean. Soudelor's winds died down a little but rebounded to with over 100 kts (115 mph) before hitting Taiwan . Although Soudler was still a powerful typhoon when it hit land most deaths and destruction were caused by flooding and mudslides from heavy rainfall not from strong winds. The rugged terrain over typhoon amplified

GPM Sees Typhoon Soudelor On Taiwan's Doorstep

The GPM core observatory satellite continued to provide excellent coverage of Soudelor as the typhoon closed in on Taiwan. GPM flew directly above typhoon Soudelor's eye on August 7, 2015 at 1041Z (6:41 PM Local Time) when wind speeds were 110 kts (127 mph). Rainfall data from GPM's Microwave Imager (GMI) and Dual-Frequency Precipitation Radar (DPR) instruments revealed very heavy rainfall in spiraling bands rotating around a decaying inner eye wall. Precipitation intensity can be measured by the Dual-Frequency Precipitation Radar instrument mounted on the GPM core observatory satellite. Some

GPM Has Another Good Look At Soudelor

Typhoon Soudelor's winds had dropped to 95 kts ( 109 mph) when the GPM core observatory satellite had another excellent daytime view on August 6, 2015 at 0006 UTC. GPM's Dual-Frequency Precipitation Radar (DPR) data showed that Soudelor had heavy rainfall in an inner eye wall and also in a much larger replacement outer eye wall. The heaviest rain found by GPM was dropping at a rate of close to 70 mm (2.4 inches) per hour in a strong feeder band spiraling in on the southwestern side of the typhoon. Radar reflectivity data from GPM's Dual-Frequency Precipitation Radar (DPR) data were also used

GPM IMERG precipitation rates and totals from Tropical Cyclone Freddy, Feb. 6 - March 12, 2023. Credit: NASA 

Download in high resolution from the NASA Goddard Scientific Visualization Studio

Cameras outside the International Space Station captured dramatic views of Hurricane Zeta at 12:50 pm ET October 28, as it churned 200 miles south-southwest of New Orleans packing winds of 90 miles an hour. Credit: NASA International Space Station

GPM overpass of Tropical Storm Zeta on October 25 at approximately 2:15pm CDT (19:15 UTC). Half-hourly rainfall estimates from NASA’s multi-satellite IMERG dataset are shown in 2D on the ground, while rainfall rates from GPM’s DPR instrument are shown as a 3D point cloud, with liquid precipitation shown in green, yellow and red, and frozen precipitation shown in blue and purple. Credit: NASA Goddard Scientific Visualization Studio

View an interactive 3D visualization of this overpass in STORM Event Viewer

GPM captured Dorian at 10:41 UTC (6:41 am EDT) on the 4th of September when the storm was moving north-northwest parallel to the coast of Florida about 90 miles due east of Daytona Beach.  Three days earlier, Dorian had struck the northern Bahamas as one of the most powerful Category 5 hurricanes on record in the Atlantic with sustained winds of 185 mph.  The powerful storm to ravaged the northern Bahamas for 2 full days.  During this time, Dorian began to weaken due to its interactions with the islands as well as the upwelling of cooler ocean waters from having remained in the same location...

The Global Precipitation Measurement (GPM) Core Observatory captured these images of Hurricane Dorian on September 1st  (21:22 UTC) as the storm was directly over Abaco Island in The Bahamas.  At that time, the storm was a category 5 hurricane with maximum sustained winds of 185 mph (295 km/h) with gusts over 200 mph.

Hurricane Dorian on September 1, 2019 (21:22 UTC) over Abaco Island in The Bahamas

Visualizers: Kel Elkins (lead), Greg Shirah, Alex Kekesi

For more information or to download this public domain video, go to  https://svs.gsfc.nasa.gov/4751#27911

Hide Body

Hide Date