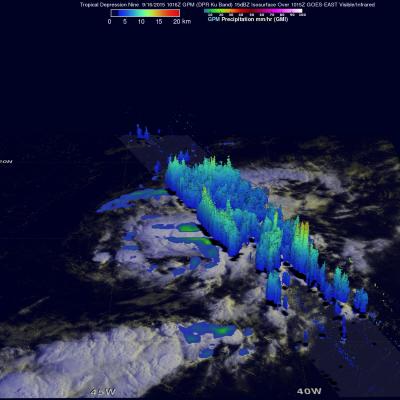
GPM Sees Powerful Storms Within Tropical Storm Ida
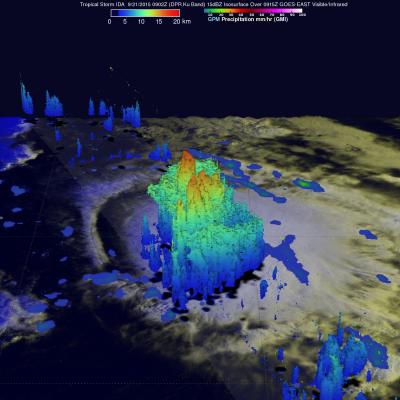
The GPM core observatory satellite found that tropical Storm IDA contained some very powerful convective thunderstorms when the satellite passed over on September 21, 2015 at 0902 UTC (05:02 AM EDT). The satellite passed directly above the most powerful storms within IDA where rain was measured by GPM's Microwave Imager (GMI) and Dual-Frequency Precipitation Radar (DPR) instruments. DPR found that some thunderstorms were dropping rain at a rate of over 142 mm (5.6 inches) per hour. GPM's DPR (Ku Band) radar data were used examine the 3-D structure of precipitation within tropical storm IDA