Meandering Ida's Precipitation Measured By GPM
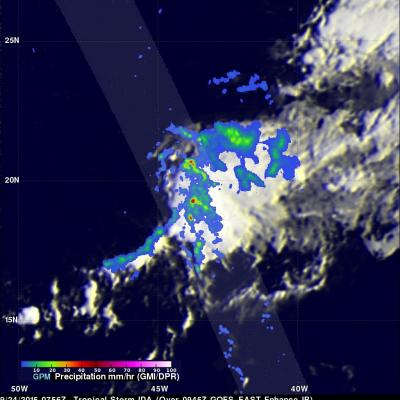
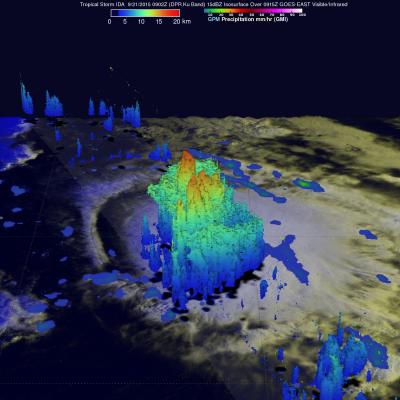
The GPM core observatory satellite had another good view of meandering tropical storm Ida located in the central Atlantic Ocean on September 24, 2015 at 0756 UTC (3:35 AM EDT). Measurements of precipitation by GPM's Microwave Imager (GMI) and Dual-Frequency Precipitation Radar (DPR) instruments showed that Ida still contained a few embedded strong convective thunderstorms that were dropping heavy rainfall. Some rainfall was measured by GPM's Ku Band radar falling at a rate of 122 mm (4.8 inches) per hour. GPM's 3-D radar reflectivity data (DPR Ku band) can be used to reveal the intensity of