Tropical Storm Kate Examined By GPM
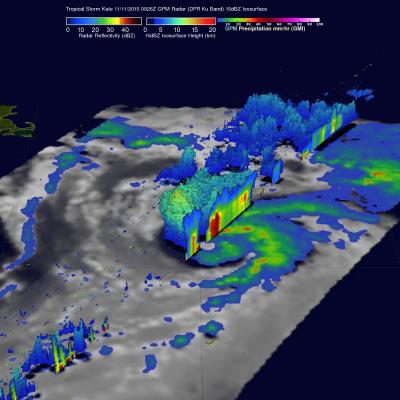
Kate became the twelfth named tropical cyclone of the of the 2015 Atlantic hurricane season when it formed near the southeastern Bahamas on Sunday November 8, 2015. Kate re-curved toward the northeast and moved harmlessly over the open waters of the Atlantic. Kate's intensity peaked on November 11, 2015 with winds of about 65 kts making it a category one hurricane on the Saffir-Simpson Hurricane. The GPM core observatory satellite flew above Kate on November 11, 2015 at 0926 UTC (4:26 AM EST) capturing data used in these images. Kate's maximum sustained winds were estimated at about 60 kts (69