Typhoon IN-FA's Extreme Rainfall Measured By GPM
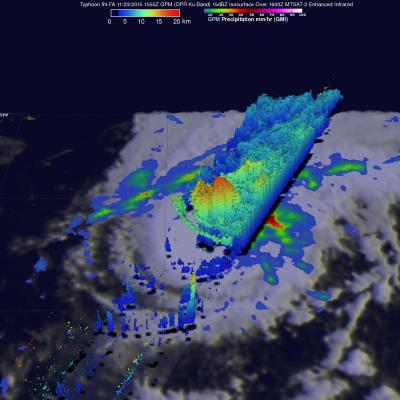
Typhoon IN-FA's peaked as a category four tropical cyclone on the Saffir-Simpson scale with maximum sustained winds of about 115 kts (132 mph) on November 21, 2015. IN-FA's winds had decreased to about 90 kts (103.5 mph) when the GPM core observatory satellite flew over on November 23, 2015 at 1555 UTC. Measurements by GPM's Dual-Frequency Precipitation Radar (DPR) instrument indicated that IN-FA was dropping rain at an extreme rate of over 266 mm (10.5 inches) per hour in storms just to the northwest of the typhoon's eye. GPM's radar (DPR Ku Band) were used to show the 3-D structure of