GPM Views Atlantic Low Monitored By The National Hurricane Center
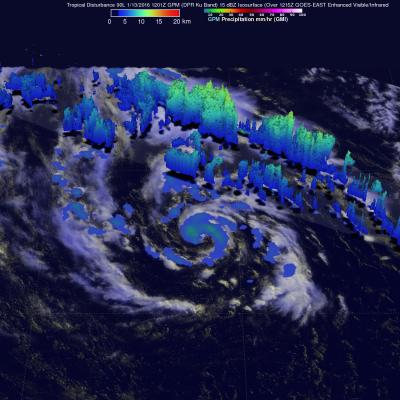
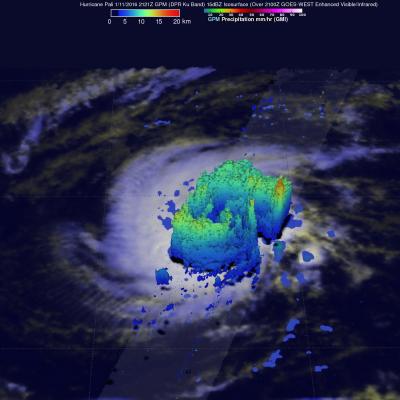
A low pressure center located 1100 miles southwest of the Azores has been monitored by the National Hurricane Center (NHC) for possible development into a non-tropical or tropical storm. This low was producing winds of over 52 kts (60 mph). The Atlantic hurricane season runs from June through November so a tropical storm developing this early in the year would be unusual but not unprecented. The GPM core observatory satellite had an excellent daytime look at this area of disturbed weather on January 13, 2016 at 1201 UTC. GPM's Microwave Imager (GMI) and Dual-Frequency Precipitation Radar (DPR)