GPM Spots Potential South Indian Ocean Tropical Cyclone
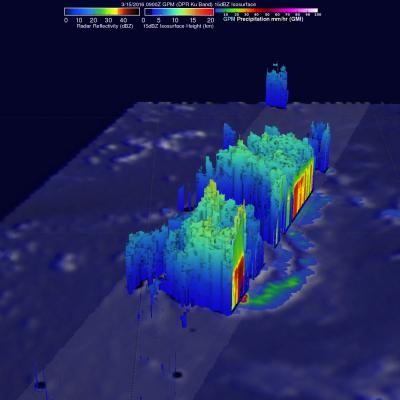
The GPM Core Observatory satellite saw possible tropical cyclone formation in the South Indian ocean on March 15, 2016 at 0900 UTC. A rainfall analysis using data collected by GPM's Microwave Imager (GMI) and Dual-Frequency Precipitation Radar (DPR) shows rain bands wrapping around a tropical low. GPM's DPR measured rain falling at the extreme rate of over 220 mm (8.7 inches) per hour in powerful storms south of the low's center of circulation. GPM's radar (DPR Ku Band) data were able to show the 3-D structure of precipitation within the tropical low. Storm tops heights were measured by GPM