GPM Flies Over Dissipating Tropical Cyclone Corentin
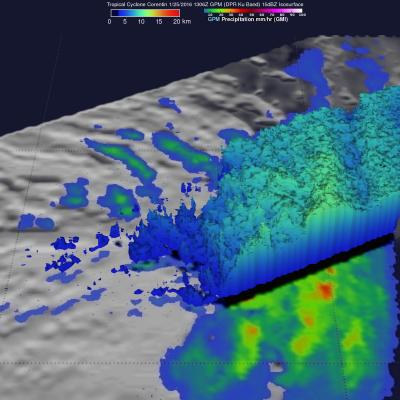
Tropical cyclone Corentin was the first named tropical cyclone of 2016 in the South Indian Ocean. Corentin caused little danger because it's genesis, maturation and dissipation have all occurred over the South Indian Ocean about equidistant from the distant shores of Madagascar and Australia. The GPM core observatory satellite flew over Tropical Cyclone Corentin on January 25, 2016 at 1306 UTC. High vertical wind shear was starting to take it's toll on the increasingly disorganized tropical cyclone. Rainfall collected by GPM Microwave Imager (GMI) and Dual-frequency Precipitation Radar (DPR)