Logo for GPM Applications showing ecology, water and agriculture, energy, disasters, health, and weather.

Applications


Overview

The Global Precipitation Measurement (GPM) mission has several cross-cutting application areas which contribute to and enhance our understanding of weather forecasting, disasters, ecology, health, water and agriculture and energy. Using advanced space-borne instruments, GPM measures light rain to heavy rain and falling snow, producing a near-global view of precipitation every 30 minutes. Through improved measurements of rain and snow, precipitation data from the GPM mission is used by a diverse range of applications and user communities at local to global scales to inform decision making and policy that directly benefits society. 

Sections

What are Applications? 

“Applications” refers to the use of mission data products in decision-making activities for societal benefit. Mission Applications take a satellite's data products and expands them into areas where they can help inform policy or decisions. 

Learn more about Applied Sciences at NASA

Who's Using GPM Data?

Learn about the different people and organizations that are using GPM and other NASA Earth data to help improve life around the world. 

View Articles


GPM Mentorship Program

NASA’s GPM applications team and University of Coimbra’s Earth and Space Science Center (CITEUC Portugal) have collaborated to host the GPM Mentorship Program for several years.

The program supports new and existing user communities to provide a tailored hands-on learning experience in using GPM data for applications. It provides participants with training and tools to use state-of-the-art GPM satellite-based precipitation estimates, and helps them apply GPM data to support real-world problems and benefit their communities. 

Learn more about each GPM Mentorship Program session2024, 2023, 2022


GPM Data for Decision Making

Are you using GPM satellite precipitation data in your work, or would you like to? Share your story with our team, or ask us any questions you may have using our contact form.

We also encourage you to get involved in GPM applications by attending an applications event or accessing the free and publicly available data in the data section of this site

  • Dalia Kirschbaum (NASA GSFC), GPM Mission Associate Deputy Project Scientist for Applications
  • Andrea Portier (NASA GSFC / SSAI), GPM Applications and Outreach Coordinator
  • Dorian Janney (NASA GSFC / ADNET), GPM Outreach Specialist
  • Jacob Reed (NASA GSFC / Telophase), GPM Web Developer

Applications Featured Resources

NASA/JAXA GPM Satellite Eyes Hurricane Ida Shortly Before Landfall
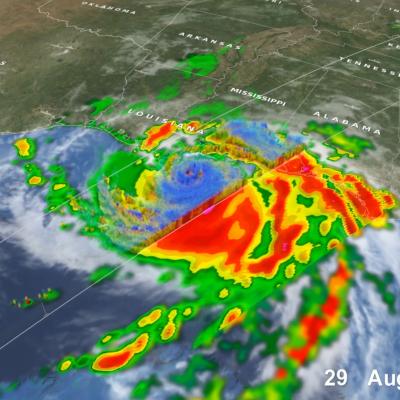
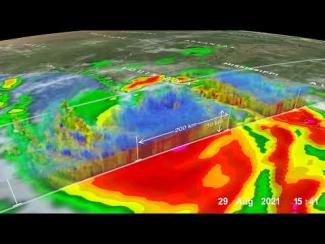
Hurricane Ida struck southeast Louisiana as a powerful Category 4 storm on Sunday, Aug. 29, 2021 - the 16th anniversary of Hurricane Katrina’s landfall in 2005. Ida brought destructive storm surge, high winds, and heavy rainfall to the region, and left over 1 million homes and businesses without power, including the entire city of New Orleans. The NASA / JAXA GPM Core Observatory satellite flew over the eye of Ida shortly before landfall at 10:13 a.m. CDT (1513 UTC), capturing data on the structure and intensity of precipitation within the storm. This animation shows NASA's IMERG multi
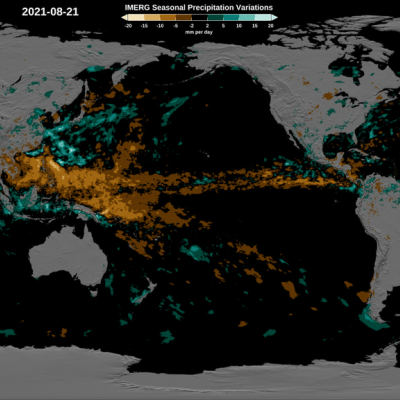
IMERG Precipitation Anomalies
Climate change impacts all of us in various ways. Changes in soil moisture have a pronounced effect on agricultural production, which in turn impacts the food we grow to eat. Changes in precipitation patterns are leading to increases in drought in certain regions and causing flooding in others. All of these impacts are influenced by interactions among processes within the Earth system involving the atmosphere, ocean, land, ice, and life. These natural interactions, combined with human influences such as the release of greenhouse gases, serve to drive the climate system resulting in distinct
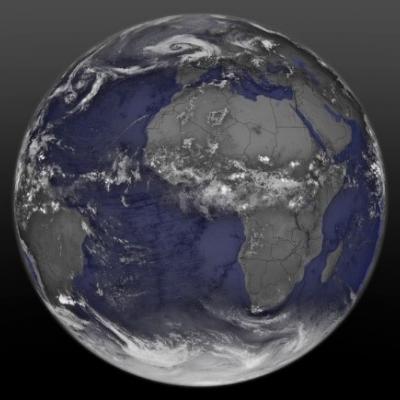
GOES Model of Earth's Climate
Climate researchers around the world are taking advantage of NASA satellite observations to help inform, improve, and enhance climate models. NASA data helps to predict the future of Earth's climate and improve the predictive capability of models. This gives decision-makers the tools they need to make better decisions on how we live, including understand the changing impacts of hurricanes and improving predictions of fire seasons. But how exactly does NASA data support climate modeling activities, and how does the data improve these models? We’re here to explain the inner workings of how NASA
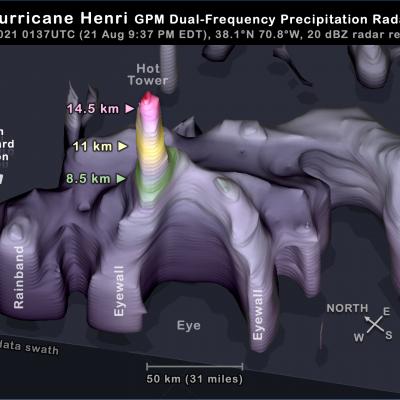
GPM DPR overflight of Hurricane Henri 22 Aug 2021
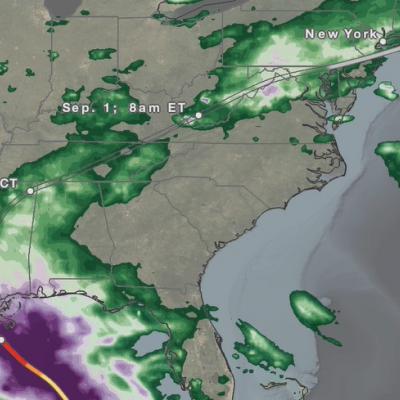
In the North Atlantic, the tropical system known as Henri reached hurricane status on Saturday, August 21, 2021. At the time, it was approaching a landfall in New England. Between Friday and Sunday, Henri was observed three times by the Dual-frequency Precipitation Radar (DPR) on the core satellite of NASA's Global Precipitation Measurement (GPM) mission. The GPM satellite's first two flyovers of Henri occurred just 10 hours apart and revealed a remarkably unchanging structure that was being impacted by wind shear. A third overflight occurred a day later, when wind shear had abated and Henri
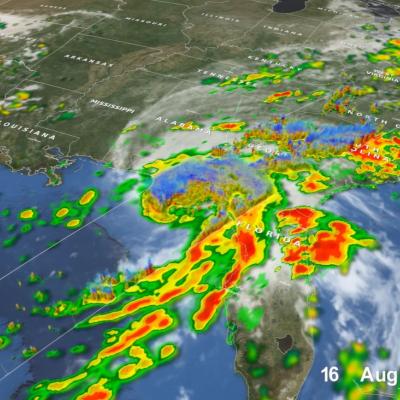
GPM Overpass of Tropical Cyclone Fred on August 16, 2021.
Tropical Storm Fred, the 6th named storm of the 2021 Atlantic hurricane season, began as a westward moving disturbance in the central Atlantic east of the Lesser Antilles. The system passed through the southern Leeward Islands during the early morning hours of August 10 but still lacked a well-defined center of circulation. Despite significant thunderstorm activity within the system, it wasn’t until late that evening, when the system was passing just south of Puerto Rico, that the National Hurricane Center (NHC) identified a well-defined circulation and upgraded the system to Tropical Storm
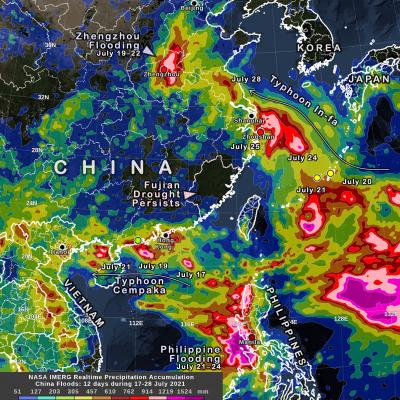
IMERG precipitation over China for July 17 to 28, 2021
During July 17 to 28, 2021, several storm systems brought heavy rain to parts of China and surrounding countries, while a nine-month-long drought persists in an adjacent part of China. NASA's multi-satellite precipitation algorithm has been monitoring this rainfall in near real-time, and the estimates are distributed to weather-forecasting agencies and disaster-monitoring organizations. This algorithm is called IMERG, the Integrated Multi-satellitE Retrievals for GPM. GPM is the NASA / JAXA Global Precipitation Measurement mission, which launched its Core Observatory satellite in 2014. Two
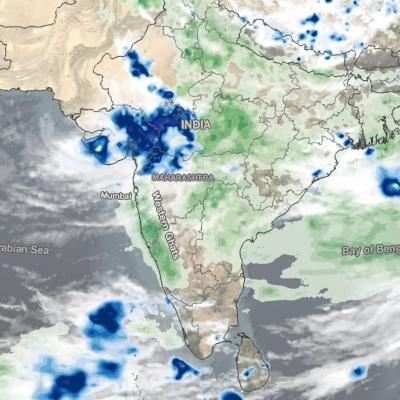
IMERG analysis of monsoon rainfall in India, July 2021
After a relatively quiet period of below normal activity that began in the latter part of June and extended into the first half of July, and which resulted in rainfall deficits over much of India, the South Asian monsoon surged to life last week, bringing heavy rains, widespread flooding and landslides. Among the hardest hit areas was the western state of Maharashtra, which extends from the central west coast of India inland. A key geographical feature along the west coast of India is the Western Ghats. This coastal mountain range runs roughly north-south for about 1000 miles along the west
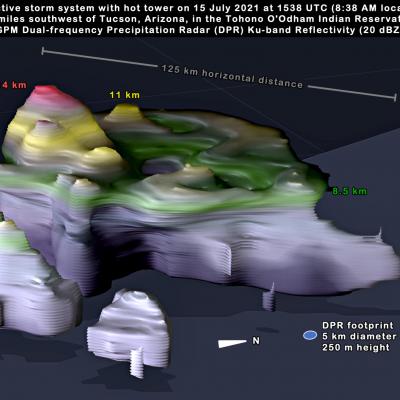
Arizona GPM DPR Convective Storm 3D View 2021 July 15
There is a monsoon that occurs in the southwestern U.S. each summer, and it brought heavy rain to the deserts of Arizona this week. This monsoon is less well known than India's Summer Monsoon, but both monsoons have similar causes [1, 2, 3]. In western Mexico and the southern edge of the southwest U.S., most of the year's rain typically falls in just three months: June, July, and August. The region is shown in light blue in the below climate map, which shows where summer rainfall predominates (Figure 1). This seasonal pattern is known as the North American Monsoon. The map was generated using
IMERG Rainfall Totals from Cyclone Tauktae
NASA combined data from multiple satellites in the GPM Constellation to estimate precipitation rates and totals from Tropical Cyclone Tauktae in May 2021. The below animation shows precipitation rates (blue/yellow shading) and accumulations (green shading) at half-hourly intervals from May 12-19, 2021, derived from NASA's IMERG algorithm. Underneath the precipitation data, cloud cover is shown in shades of white/gray based on geosynchronous satellite infrared observations. On top of the precipitation data, the cyclone's approximate track is displayed based on estimates from the Joint Typhoon
World Resources Institute Ethiopia
NASA’s Earth observation data are used in a wide variety of ways to improve life for humans and other animals across the world every day. Our climate is changing, and these changes include differences in temperature and precipitation patterns around the globe. As you might imagine, these changes bring about both anticipated and unanticipated consequences that have a profound impact on people around the world. Many organizations are responding to the amazing yet complicated wealth of data that can be used to successfully monitor many aspects of our global environment. The World Resources

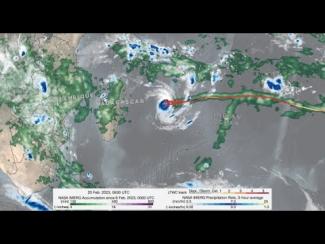
GPM IMERG precipitation rates and totals from Tropical Cyclone Freddy, Feb. 6 - March 12, 2023. Credit: NASA 

Download in high resolution from the NASA Goddard Scientific Visualization Studio

In a series of three half-day virtual meetings, this workshop will focus on current applications and future opportunities of NASA precipitation and cloud data products to support transport and logistical activities for aviation, maritime, roads and highway transportation systems. The workshop will bring together representatives from federal and state operational agencies and private companies to discuss how NASA precipitation and cloud products could be better leveraged to inform decision-making for transport and logistical operations. The workshop will also provide an opportunity for end...

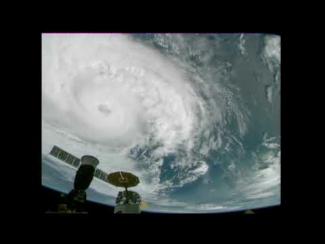
Cameras outside the International Space Station captured dramatic views of Hurricane Zeta at 12:50 pm ET October 28, as it churned 200 miles south-southwest of New Orleans packing winds of 90 miles an hour. Credit: NASA International Space Station

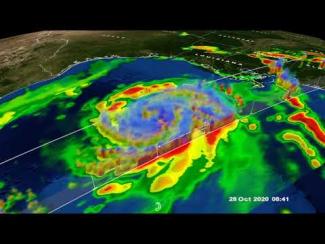
GPM Core Observatory overpass of Tropical Storm Zeta on October 28 at approximately 3:25am CDT (8:25 UTC). Credit: NASA Goddard Scientific Visualization Studio

View an interactive 3D visualization of this overpass in STORM Event Viewer

Hide Body

Hide Date

Hide Main Image

Hide Title