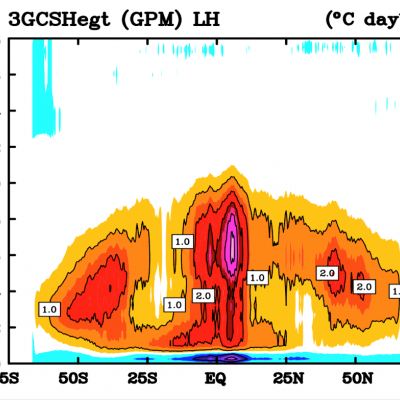
Articles

GPM Applications: Energy
In many areas, energy infrastructure assets, such as power plants and electric grids, can suffer damage or disruption in service due to a variety of climate-related impacts like extreme precipitation, high temperatures, drought, and rising sea levels. For example, warmer temperatures and little rainfall can cause changes in peak streamflow conditions that affect hydropower generation. Heavy precipitation events and flooding can impact a region’s energy infrastructure, including electric grid equipment, which has cascading effects on freshwater supplies and emergency services. The Energy
GPM Applications: Ecology
The impacts of climate change are already having a profound effect on ecosystems. Changes in temperature and precipitation patterns affect species and communities in diverse ways, such as declines in species and species diversity, changing interactions between species, and modification of ecosystems. Effective ecosystem management is critical to maintaining and repairing the natural environments in order to reliably support human needs while conserving and sustaining ecological services and diversity. Satellite observations can provide critical information relevant to the distribution of
GPM Catches Typhoon Yutu Making Landfall
NASA's GPM Core observatory satellite captured an image of Super Typhoon Yutu when it flew over the powerful storm just as the center was striking the central Northern Mariana Islands north of Guam. Early Thursday, Oct. 25 local time, Super Typhoon Yutu crossed over the U.S. commonwealth of the Northern Mariana Islands. It was the equivalent of a Category 5 hurricane. The National Weather Service in Guam said it was the strongest storm to hit any part of the U.S. this year. Download this video in high resolution from the NASA Goddard Scientific Visualization Studio Download video without...
Dive Into a 360-View of Hurricane Maria
Two days before Hurricane Maria devastated Puerto Rico, the NASA/JAXA Global Precipitation Measurement Core Observatory satellite captured a 3D view of the 2017 storm. At the time Maria was a category 1 hurricane. The 3-D view reveals the processes inside the hurricane that would fuel the storm’s intensification to a category 5 storm within 24 hours. For the first time in 360 degrees, this data visualization takes you inside the hurricane. The precipitation satellite has an advanced radar that measures both liquid and frozen water. The brightly colored dots show areas of rainfall, where green...
GPM flying over Earth with a data swath visualized.
We Want You to Go to Class! Our students desperately need to have some face to face time with scientists and engineers who are doing amazing things to make their world a better place. That means you guys! From time to time, you may be invited to give a presentation on your work to kids in some context- and we want to make it easier for you. You might even reach out yourself to your local school and offer to come in and give a talk. Having been a classroom teacher across all grade levels by the time I finished my illustrious career, I know personally the joy of having real STEM professionals...