TRMM News

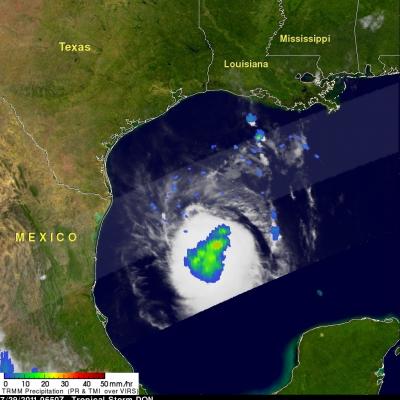
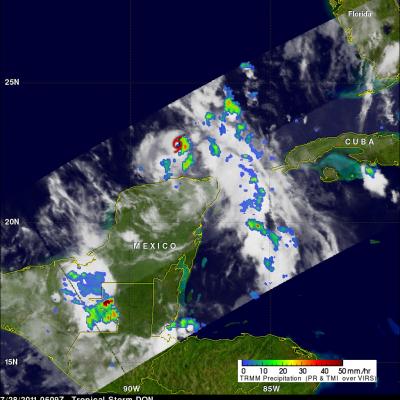
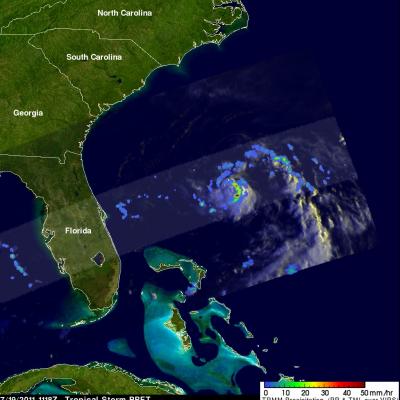
TRMM Sees Don At Daybreak

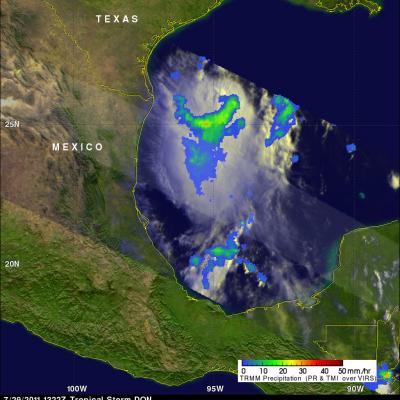
The TRMM satellite again viewed tropical storm DON on 29 July 2011 at 1322 UTC (7:22 AM CDT). A rainfall analysis from TRMM's Microwave Imager (TMI) was overlaid on a sunlit combination visible/infrared image from TRMM's Visible and Infrared Scanner (VIRS) instrument. Below is an animation that fades between the sunlit visible/infrared image and the PR/TMI rainfall analysis.

Tropical Storm Don Approaching Texas

The TRMM satellite passed over tropical storm DON on 29 July 2011 at 0650 UTC (1:50 AM CDT) while the storm was in the Gulf Of Mexico. TRMM's Microwave Imager (TMI) data were used in the image on the right to show rainfall overlaid on an infrared image from TRMM's Visible and InfraRed Scanner (VIRS) instrument. This image shows that DON had become larger and better organized since last seen by TRMM. Also the area of rainfall was larger with some moderate to heavy rainfall located near the storm's center. Texas has been suffering from extreme drought this year so DON's rainfall may provide some

Tropical Storm Don Forms In The Gulf Of Mexico

An area of disturbed weather in the southern Gulf Of Mexico was upgraded by the National Hurricane Center (NHC) to tropical storm DON on 27 July 2011 at 2100 UTC (4 PM CDT). The TRMM satellite had a fairly good view of tropical Storm DON when it passed over on 28 July 2011 at 0609 UTC (2:09 AM EDT). A red tropical storm symbol shows the position, north of Mexico's Yucatan peninsula, where DON was located at that time. A rainfall analysis from TRMM's Microwave Imager (TMI) data shows that DON was dropping moderate to heavy rainfall in the eastern side of the small storm. The NHC predicts that

Tropical Wave (90L) Forming in the Caribbean

On 26 July at 1435 UTC (10:35 AM EDT) the TRMM satellite passed above a tropical wave in the Caribbean Sea southwest of Cuba. On 27 July this area was given a high (80%) probability of development into a tropical cyclone by the National Hurricane Center (NHC). TRMM's Precipitation Radar (PR) data indicates that a convective tower within this area of disturbed weather reached to heights of over 15 km (~9.3 miles).

TRMM Precipitation Radar Sees Two Tropical Storms Developing

The TRMM satellite saw two tropical storms in the western Pacific Ocean as they were in early stages of development. These 3-D views were made from TRMM's Precipitation Radar (PR) data collected on 25 July 2011 at 1631 UTC and 26 July 2011 at 0049 UTC. Those data show that developing tropical storms NOCK-TEN (10W) and 11W both had towering convective storms near their centers of circulation that extended to heights above 15km (~9.3 miles). These tall towers are associated with convective bursts and can be a sign of future strengthening because they indicate areas where energy is being released

Typhoon Brings Heavy Rain to Southern Japan

Typhoon Ma-On formed from an area of disturbed weather in the northwest Pacific halfway between Wake Island and the Northern Marianas on the 11th of July 2011. The system slowly developed and became a typhoon two days later on the 13th as it continued tracking westward. Ma-On then reached its maximum intensity on the 15th with sustained winds estimated at 115 knots (~132 mph), making it a Category 4 typhoon, before turning northward towards southern Japan. Ma-On began to weaken as it neared the southeast coast of Japan where it briefly made landfall in southern Tokushima Prefecture on the

TRMM Views Hurricane Dora

The TRMM satellite had an excellent view of hurricane Dora in the eastern Pacific Ocean southwest of Mexico when it passed over on 20 July 2011 at 1015 UTC. Dora is predicted to become a powerful category 3 hurricane but stay well off the Mexican coast.

MA-ON Weakens

Typhoon MA-ON had weakened to a strong tropical storm with wind speeds of about 60 kts (69 mph) when the TRMM satellite again flew over on 19 July 2011 at 2348 UTC. The rainfall analysis above using TRMM's Microwave Imager (TMI) and Precipitation Radar (PR) data was overlaid on a daylight visible/infrared image from TRMM's Visible and InfraRed Scanner (VIRS) instrument. It reveals that although weaker MA-ON was dropping heavy rainfall over southern areas of the Japanese Island of Honshu. A red tropical storm symbol shows the location of MA-ON's center of circulation at that time. Click here to

Tropical Storm BRET

The TRMM satellite flew over tropical storm Bret in the Atlantic Ocean north of the Bahamas on 19 July 2011 at 1118 UTC ( 7:18 AM EDT). This early morning pass showed that BRET was very small, but TRMM's Precipitation Radar (see below) showed that the storm had some powerful thunderstorms reaching to heights of 15km (9.3 miles).

TRMM Shows Typhoon Drenching Southern Japan

The TRMM satellite saw typhoon MA-ON on 18 July 2011 at 2306 UTC and again on 19 July 2011 at 0221 UTC. The rainfall analysis above used TRMM's Microwave Imager (TMI) and Precipitation Radar (PR) data from both orbits. It shows that bands of very heavy rainfall of over over 50 mm (~2 inches) were falling over both of the Japanese island of Shikoku and Honshu. At the time of the later TRMM orbit MA-ON's winds had weakened to about 67 kts (~77 mph) making it a category 1 typhoon on the Saffir/Simpson scale. MA-ON is expected to move toward the east-southeast and weaken as it continues to affect