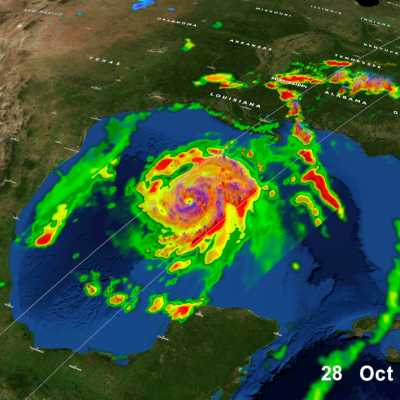
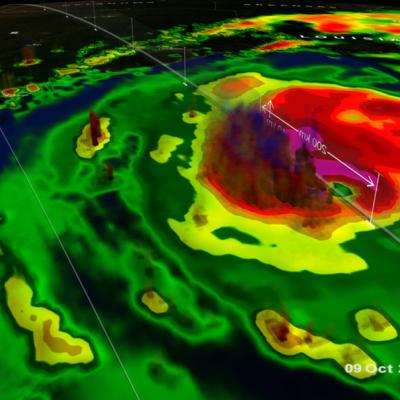
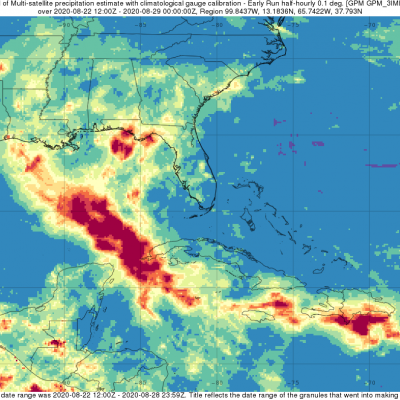
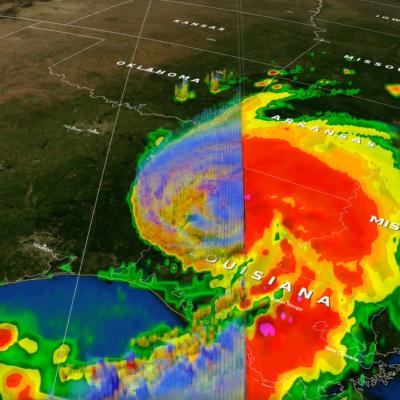
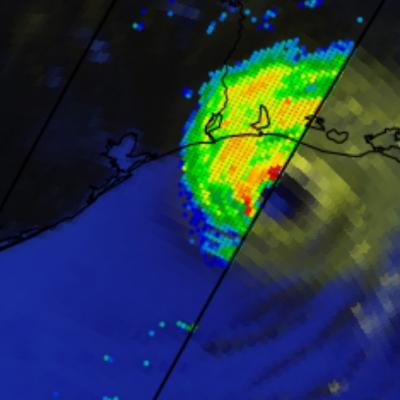
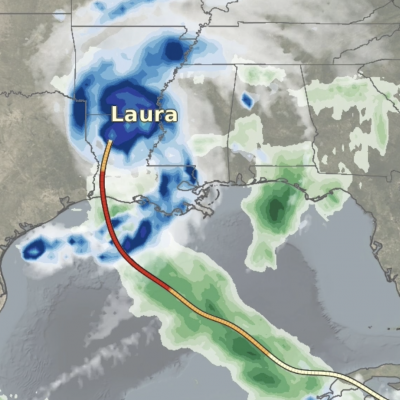
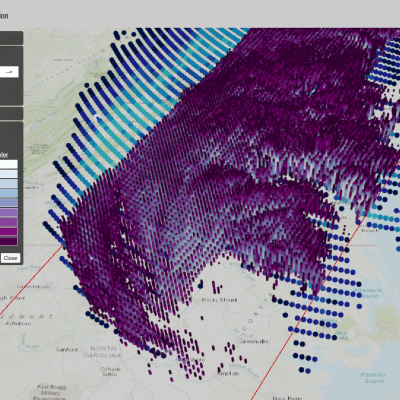
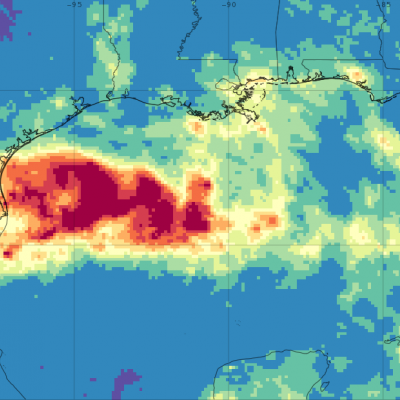
Hurricanes

Hurricane Isaias Impacts the US East Coast
From July 29 to August 5, 2020, NASA’s IMERG algorithm observed tropical storm Isaias’ rainfall over the Caribbean and large parts of the Eastern US. This animation shows the IMERG rain rates in green shading as Isaias tracked from the tropical Atlantic into the Caribbean, then northward along the Atlantic coast and into New England. The yellow line shows the location of Isaias' low-pressure center, as tracked by the National Hurricane Center and smoothed in time here for the animation.
IMERG Hurricane Hanna 7-27-20 cropped
Hanna formed from a westward propagating tropical easterly wave that entered the southeast corner of the Gulf of Mexico on Tuesday July 21st. The wave provided a focus for shower and thunderstorm activity, which then led to the formation of an area of low pressure over the central Gulf of Mexico. The National Hurricane Center (NHC) found that this low had developed a closed circulation by the evening of Wednesday July 22nd, making it Tropical Depression #8. Over the next 24 hours, the depression slowly organized and intensified over the central Gulf before reaching tropical storm intensity on
GPM Hurricane Douglas 7-25-20
Hurricane Douglas continued to approach the Hawaiian islands during this GPM overpass early in the morning (02:11 UTC) of July 25, 2020. Douglas had previously strengthened to a Category 4 hurricane the day before, but had substantially weakened over cooler waters throughout the day. Regardless, the GMI and DPR instruments recorded rain rates near 50 millimeters/hour (~2 inches/hour) near Douglas` center. The Central Pacific Hurricane Center advised residents of Hawaii to expect hurricane-strength winds and rainfall starting Saturday evening and lasting through Monday. View fullscreen in STORM

GPM IMERG Measures Hurricane Dorian's Rainfall from the Caribbean to Canada

Hurricane Dorian (2019) brought heavy rain to the Caribbean, along the US East Coast, and up to Canada. NASA satellite-based precipitation estimates tracked the storm throughout its lifetime, as shown by the sequence of images below. September 3, 2019: Hurricane Dorian over Grand Bahama and Abaco Islands In the early hours of Tuesday, September 3, Hurricane Dorian had been stationary over the island of Grand Bahama for 18 hours, most of the time as a category 5 hurricane. Storm-total rain accumulation over parts of Grand Bahama and Abaco islands have exceeded 24 inches according to NASA
GPM Overpass of Hurricane Dorian
Tropical cyclones, known as hurricanes in the western hemisphere, can bring damaging high winds, storm surge, and flooding rainfall to the coastal communities they hit. Satellite instruments - and the detailed near real-time atmospheric data that they provide - have revolutionized the way we see hurricanes and other disasters as they happen. But it’s about more than just seeing. NASA, working with counterparts at NOAA, FEMA, and elsewhere are sharing ever more precise data to aid local communities in coping with disasters. With better information, emergency responders have the tools to make...
GPM observes Hurricane Dorian lashing Florida
Download in high resolution from the NASA Goddard Scientific Visualization Studio GPM captured Dorian at 10:41 UTC (6:41 am EDT) on the 4th of September when the storm was moving north-northwest parallel to the coast of Florida about 90 miles due east of Daytona Beach. Three days earlier, Dorian had struck the northern Bahamas as one of the most powerful Category 5 hurricanes on record in the Atlantic with sustained winds of 185 mph. Weakening steering currents allowed the powerful storm to ravage the northern Bahamas for 2 full days. During this time, Dorian began to weaken due to its...
Hurricane Dorian Brings Heavy Rain to Bahamas
In addition to the powerful winds that have raked the northern Bahamas over the past few days, Hurricane Dorian’s slow motion has brought very heavy rainfall to the islands as well. Dorian first formed into a tropical depression on the 24th of August about 800 miles east southeast of Barbados in the Lesser Antilles from an area of low pressure; the depression was quickly upgraded to a minimal tropical storm and named Dorian by the National Hurricane Center (NHC) later in the day. As Dorian made its way westward under the influence of a high pressure ridge to the north, it was held in check...
GPM Observes Hurricane Dorian Over Bahamas
Download in high resolution from the NASA Goddard Scientific Visualization Studio. The NASA / JAXA Global Precipitation Measurement (GPM) Core Observatory flew over Hurricane Dorian on September 1st (5:22pm ET / 21:22 UTC) as the storm was directly over Abaco Island in The Bahamas. The satellite captured data on rainfall rates within the storm as it flew over using its Dual-frequency Precipitation Radar (DPR) and GPM Microwave Imager (GMI). In this animation the multi-satellite GPM IMERG product is shown first to illustrate rainfall rates prior to the overpass. When the camera zooms in data...
IMERG Measures Rainfall in Hurricane Dorian
UPDATE 9/9/19: On Monday morning, September 9, Hurricane Dorian was a post-tropical storm after a mid-latitude weather front and cold seas had altered its tropical characteristics over the weekend. On Saturday and Sunday, Hurricane Dorian struck eastern Canada, causing wind damage and bringing heavy rainfall. According to the Associated Press, a peak of 400,000 people were without power in Nova Scotia, Canada, because of Dorian. This graphic shows precipitation that fell during the almost two-week period from August 27 to the early hours of September 9. The near-realtime rain estimates come...

GPM IMERG Measures Rainfall Accumulation from Hurricane Dorian in the Caribbean

Hurricane Dorian is packing heavy rain as it moves toward the Bahamas as predicted by NOAA’s NHC or National Hurricane Center. NASA's GPM mission recently analyzed the storm and found heavy rainfall in the storm as it passed through the Caribbean. This image shows estimated rainfall accumulations for the region affected by Hurricane Dorian over the 24 hour period of Aug.27 11:59 UTC to Aug. 28 11:59 UTC. The imagery was generated using the Integrated Multi-satEllite Retrievals for GPM (IMERG) “early run” product. The data indicates that up to 120 mm (4.72 inches) of rainfall accumulated in