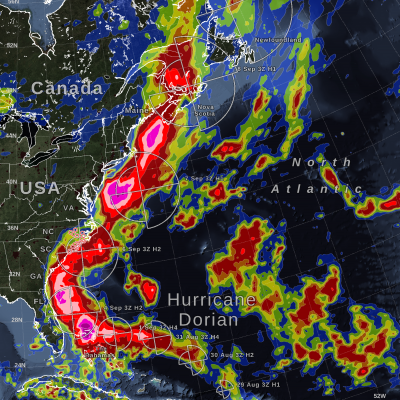
GPM IMERG Measures Hurricane Dorian's Rainfall from the Caribbean to Canada
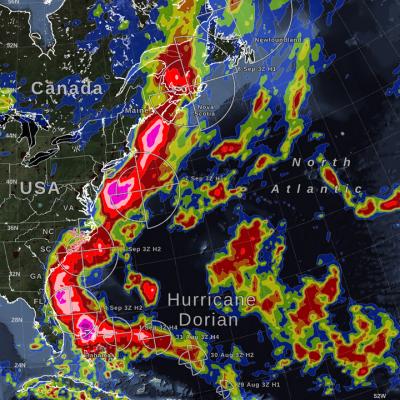
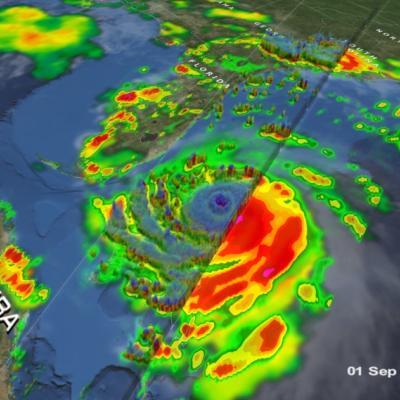
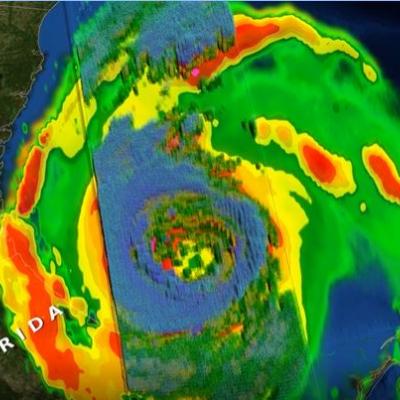
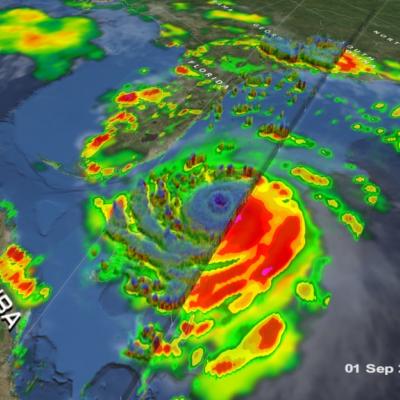
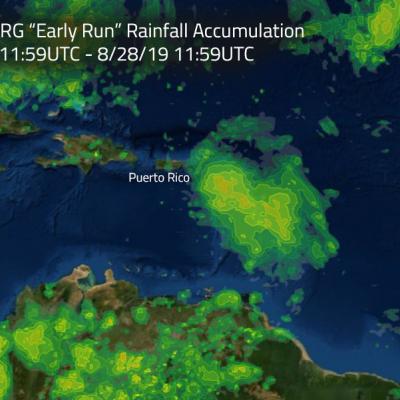
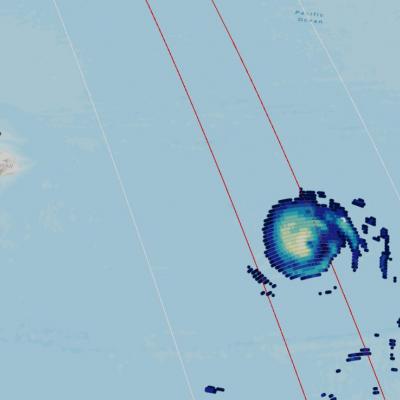
Hurricane Dorian (2019) brought heavy rain to the Caribbean, along the US East Coast, and up to Canada. NASA satellite-based precipitation estimates tracked the storm throughout its lifetime, as shown by the sequence of images below. September 3, 2019: Hurricane Dorian over Grand Bahama and Abaco Islands In the early hours of Tuesday, September 3, Hurricane Dorian had been stationary over the island of Grand Bahama for 18 hours, most of the time as a category 5 hurricane. Storm-total rain accumulation over parts of Grand Bahama and Abaco islands have exceeded 24 inches according to NASA