Madagascar

Powerful Tropical Cyclone Enawo Threatens Madagascar

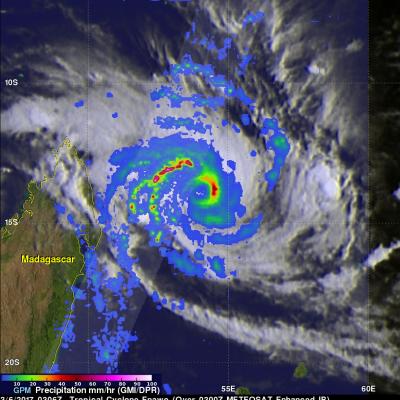
Tropical cyclone Enawo has continued to intensify while moving toward Madagascar. Enawo had winds of about 90 kts (103.5 mph) when the GPM core observatory satellite flew over on March 6, 2017 at 0306 UTC (0606 AM local time). These powerful winds make Enawo the equivalent of a category two hurricane on the Saffir-Simpson Hurricane wind scale. GPM revealed that the tropical cyclone had heavy rainfall in distinct feeder bands on the western side and in the northeastern side of the eyewall. Precipitation was measured by GPM's DPR falling at a rate of over 220 mm (8.7 inches) per hour in intense

Intensifying Tropical Cyclone Dineo Seen By GPM

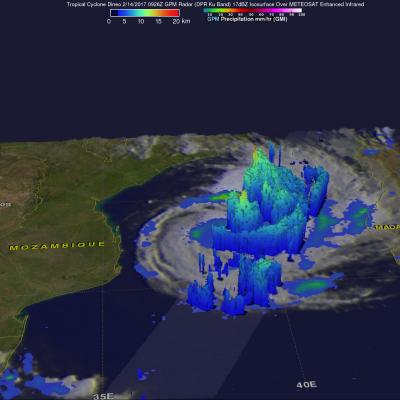
Tropical cyclone Dineo was intensifying in the middle of the Mozambique Channel when the GPM core observatory satellite flew over on February 14, 2017 at 0926 UTC. Dineo had winds of about 55 kts (~ 63.3 mph) at the time of this GPM pass. Very heavy precipitation was found in feeder bands on Dineo's northeastern side. The most intense rainfall was measured by GPM's Dual-Frequency Precipitation Radar (DPR) falling at a rate of over 132 mm (5.2 inches) per hour in the intense storms in the northeastern quadrant of the tropical cyclone. GPM's radar (DPR Ku Band) sliced through the center of

GPM Views Increasingly Powerful Tropical Cyclone Fantala

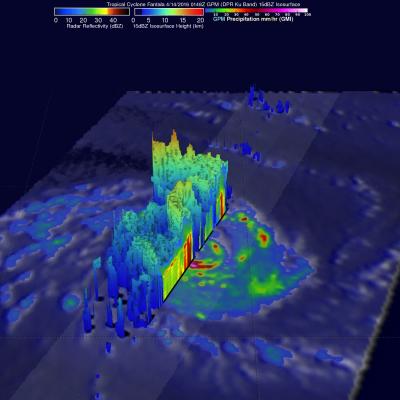
Tropical cyclone Fantala has continued to intensify while moving westward over the open waters of the South Indian Ocean. The GPM core observatory satellite passed directly over Fantala's eye on April 14, 2016 at 0148 UTC. At that time the tropical cyclone had maximum sustained winds estimated at 90 kts (104 mph) making in the equivalent of a category two tropical cyclone on the Saffir-Simpson hurricane wind scale. GPM's Microwave Imager (GMI) and Dual-Frequency Precipitation Radar (DPR) instruments again captured data that were used to estimate rainfall within Fantala. Rain was measured by

GPM Views Tropical Cyclone Forming Near Madagascar

The GPM core observatory satellite flew over a forming tropical cyclone in the South Indian Ocean between Madagascar and Reunion on February 8, 2016 at 2137 UTC. Low vertical wind shear will assist in the evolution of the tropical low as it moves slowly toward the southwest. Rainfall derived from GPM's Microwave Imager (GMI) and Dual-frequency Precipitation Radar (DPR) data revealed that powerful convective storms near Madagascar's eastern coast were found to be dropping rain at a rate of over 94 mm (3.7 inches) per hour. 3-D measurements were made of convective storm tops with GPM's radar

Tropical Cyclone Bejisa Shown Menacing Reunion

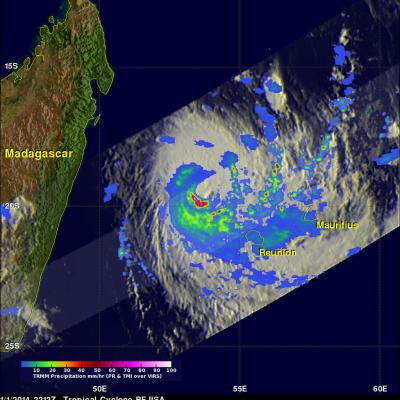
Extremely powerful tropical cyclone Bejisa has passed just to the west of the French island of Reunion in the southwest Indian Ocean. Bejisa's forward speed and very powerful winds within the tropical cyclone made this a dangerous location for Reunion. Bejisa was moving toward Reunion when the TRMM satellite had an excellent view on January 1, 2014 at 2212 UTC. Bejisa had sustained winds estimated to be over 105kts (~121 mph) at the time of this pass making it equivalent to a category three hurricane on the Saffir–Simpson hurricane wind scale. A rainfall analysis that used data from TRMM's

TRMM Sees More Powerful Bejisa

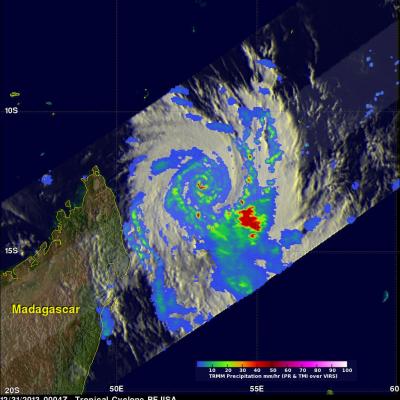
The TRMM satellite had an excellent view of intensifying tropical cyclone Bejisa northeast of Madagascar on December 31, 2013 at 0004 UTC. As expected, Bejisa became more powerful and had maximum sustained wind speeds estimated at 105 kts (~121 mph) when TRMM flew over. A rainfall analysis from TRMM's Microwave Imager (TMI) and Precipitation Radar (PR) instruments is shown overlaid on an enhanced infrared image from the Visible and InfraRed Scanner (VIRS). Extremely heavy rainfall in Bejisa's eye wall returned reflectivity values greater than 55dBZ to the Precipitation Radar (PR) instrument

Tropical Cyclone Bejisa Near Madagascar

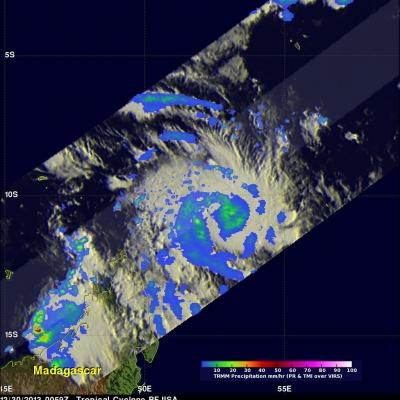
A tropical cyclone called Bejisa formed in the South Indian Ocean north-northeast of Madagascar on December 29, 2013 . The TRMM satellite flew over on December 30, 2013 at 0059 UTC. The image on the left shows a TRMM rainfall analysis for intensifying tropical cyclone Bejisa at that time when sustained winds were estimated to be greater than 60 kts (~69 mph). Data collected with TRMM's Microwave Imager (TMI) instrument provided better coverage of rainfall with this TRMM pass than the Precipitation Radar (PR) instrument that traveled to the northwest of Bejisa's center. The image on the right

Tropical Storm Haruna Intensifying

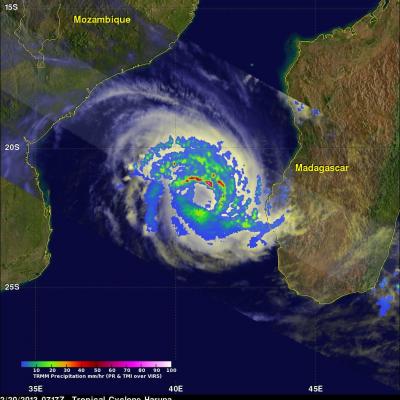
The TRMM satellite flew above intensifying tropical storm Haruna in the Mozambique Channel again on February 20, 2013 at 0717 UTC. A rainfall analysis using data from TRMM's Microwave Imager (TMI) and Precipitation Radar (PR) instruments is shown overlaid on a combination visible/infrared image from the Visible and InfraRed Scanner (VIRS). TRMM showed that Haruna had become much better organized than yesterday with intense bands of rainfall circling the tropical cyclone's center of circulation. Some rain in powerful storms on the northern edge of Haruna's center was found by TRMM PR to be

Deadly Tropical Cyclone Haruna Departs Madagascar

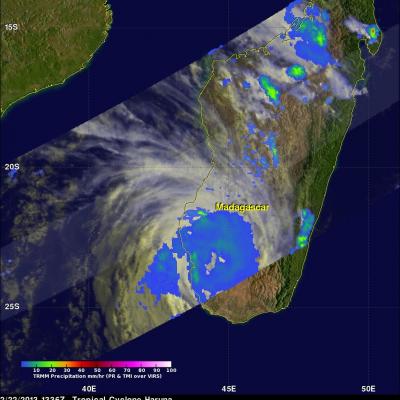
Tropical cyclone Haruna has battered southwestern Madagascar with hurricane force winds and flooding rainfall for the past two days. The city of Morombe was heavily damaged and Haruna was reported to have killed six people. The TRMM satellite passed over Haruna yesterday on February 22, 2013 at 1336 UTC when the tropical cyclone was over southwestern Madagascar. TRMM passed almost directly above weakening tropical storm Haruna again today on February 23, 2013 at 0608 UTC. Haruna weakened from category one hurricane force yesterday to tropical storm force today. Today TRMM's Microwave Imager

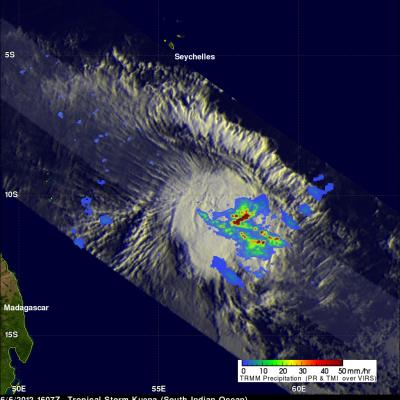
Late Season Tropical Storm Kuena Forms

A tropical storm called Kuena formed in the southwest Indian Ocean east of Madagascar on June 6, 2012. This is a little unusual because the tropical cyclone season in that area normally ends on May 15. The TRMM satellite had an excellent view of Kuena when it flew directly above the newly formed storm on June 6, 2012 at 1607 UTC. A rainfall analysis that used data from TRMM's Microwave Imager (TMI) and Precipitation Radar (PR) instruments is shown overlaid on an enhanced infrared image from TRMM's Visible and InfraRed Scanner (VIRS) instrument. This analysis shows that heavy convective storms