Philippines

Deadly Philippine Flooding And Landslides

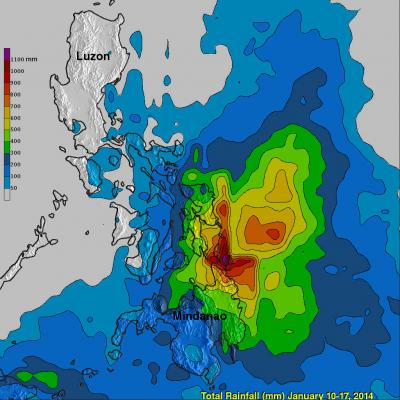
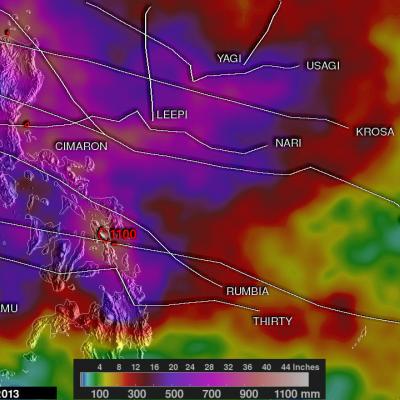
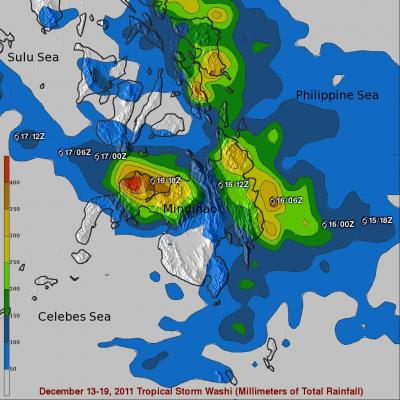
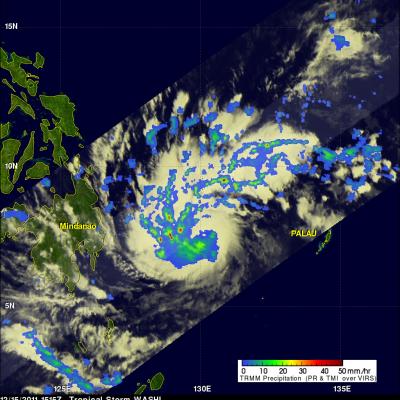
People in the southern Philippines are used to heavy rainfall this time of the year but rainfall totals have recently been exceptionally high. A tropical low northeast of Mindanao has been an almost permanent feature on weather maps for the past week. It has caused nearly continuous rain in the area of northeastern Mindanao triggering floods and landslides that have caused the reported deaths of 34 people. The TRMM Multi-Satellite Precipitation Analysis (TMPA), produced at Goddard Space Flight Center, combines the rainfall estimates generated by TRMM and other satellites (3B42) . The analysis

Philippine's Tropical Cyclone Rainfall 2013

In a normal year 30% of the total rainfall near the Philippines (northwestern Pacific Ocean) is caused by tropical cyclones. The most notable tropical cyclone this year was deadly super typhoon HAIYAN that devastated the central Philippines in November 2013. The TRMM-based, near-real time Multi-satellite Precipitation Analysis (TMPA) at the NASA Goddard Space Flight Center was used to analyze only rainfall near tropical cyclones passing close to or over the the Philippines in 2013. The TMPA analysis above shows the estimated total rainfall contributed by named tropical cyclones this year. Red

Haiyan and Tropical Storm 30 Bring Heavy Rains to the Philippines

Super typhoon Haiyan, known locally in the Philippines as Yulonda, will go down as a historic storm, making landfall in the central Philippines as perhaps the most powerful tropical cyclone to ever make landfall with sustained winds estimated at 195 mph (~315 kph). So far, over 2300 people are confirmed to have been killed by the storm, and the number is likely to climb higher with many still missing and not all areas unaccounted for. Katrina, which devasted the US Gulf coast in 2005, was responsible for 1833 fatalities The most deadly flooding from Super Typhoon Haiyan was caused by the storm
Super Typhoon Haiyan Hits the Philippines
Super typhoon Haiyan, equivalent to a Category 5 hurricane on the US Saffir-Simpson scale, struck the central Philippines municipality of Guiuan at the southern tip of the province of Eastern Samar early Friday morning at 20:45 UTC (4:45 am local time) as an extremely powerful super typhoon, perhaps the strongest ever recorded at landfall, with sustained winds estimated at 195 mph (315 kph) by the Joint Typhoon Warning Center. Previously, Hurricane Camille, which struck the northern Gulf Coast in 1969, held the record with 190 mph sustained winds at landfall. After striking Samar, Haiyan...

Super Typhoon Haiyan Moving Toward The Philippines

As predicted by the Joint Typhoon Warning Center (JTWC) typhoon Haiyan became a powerful category five typhoon with sustained winds estimated to be over 135kts (~155 mph). Super typhoon Haiyan is predicted to strike the central Philippines in a few days. Super typhoon Haiyan was located just northeast of Palau when the TRMM satellite flew above on November 6, 2013 at 1026 UTC. A rainfall analysis from TRMM's Microwave Imager (TMI) and Precipitation Radar (PR) instruments is shown overlaid on an enhanced infrared image from TRMM's Visible and InfraRed Scanner (VIRS). Data from TRMM's TMI and PR

Typhoon Haiyan (31w) Develops East Of The Philippines

The Joint Typhoon Warning Center (JTWC) predicts that typhoon HAIYAN (31W) that developed east of the Philippines will become dangerous super typhoon HAIYAN with winds of 130kts (~150mph) before it hits the southern Philippines in about three days. The TRMM satellite had a good daytime view when it flew above tropical storm HAIYAN (31W) yesterday evening on November 4, 2013 at 2353 UTC. This image shows precipitation data collected with TRMM's Microwave Imager (TMI) and Precipitation Radar (PR) instruments overlaid on a combination visible and infrared image from TRMM's Visible and InfraRed

Typhoon UTOR Hits The Philippines

A category four typhoon called UTOR hit the Philippines with wind speeds of about 120kts (~138 mph). It has been reported that at least one person was killed and 20 fishermen are missing. Landslides are also likely due to heavy rainfall that is occurring over the Philippine's rugged mountainous terrain. The image above used data collected by the TRMM satellite when it passed over UTOR on August 12, 2013 at 0621 UTC as it was exiting the Philippines into the South China Sea. TRMM's Microwave Imager (TMI) and Precipitation Radar (PR) data are shown overlaid on a combination Infrared/Visible

Tropical Storm Leepi East Of The Philippines

Today TRMM satellite also flew above tropical storm Leepi just to the east of the Philippines at 0947 UTC. Data from TRMM's Microwave Imager (TMI) and Precipitation Radar (PR) instruments found the most intense rainfall in powerful storms near Leepi's center and in rain bands spiraling into Leepi from the south. TRMM PR data were used to make this 3-D view of tropical storm Leepi's vertical structure. Some of the powerful storms near Leepi's center reached heights above 16.5km (~10.25 miles). Tropical storm Leepi is predicted by the Joint Typhoon Warning Center (JTWC) to increase slightly in

Philippines Devastated by Tropical Storm Washi

Washi, known locally in the Philippines as Sendong, began as a tropical depression on the 13th of December 2011 in the West Pacific Ocean about 2150 km (~1333 miles) due east of the southern Philippines. Washi only intensified slightly and never exceeded tropical storm intensity as it tracked due west towards the southern Philippines' island of Mindanao. Washi made landfall on the east coast of Mindanao on the afternoon of the 16th as a moderate tropical storm with sustained winds reported at 55 knots (~63 mph). Despite its modest intensity, Washi had a huge impact on the island. As Washi made

Tropical Storm Washi (27W) Strengthens

As expected tropical storm Washi (27W) had strengthened when the TRMM satellite passed over on 15 December 2011 at 1515 UTC collecting data used in the rainfall analysis shown above. TRMM Microwave Imager (TMI) and Precipitation Radar (PR) data are shown overlaid on an enhanced infrared image from the satellite's Visible and InfraRed Scanner (VIRS). This rainfall analysis shows that Washi was much better organized with very heavy rainfall of over 50mm/hr (~2 inches) revealed by TRMM PR within bands spiraling into the center of the storm. The 3-D image above used Precipitation Radar data from