tropical storms

Deadly Tropical Storm Cristobal

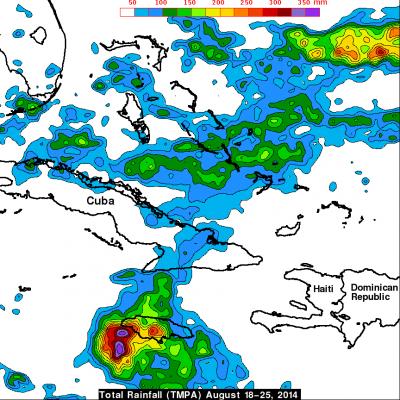
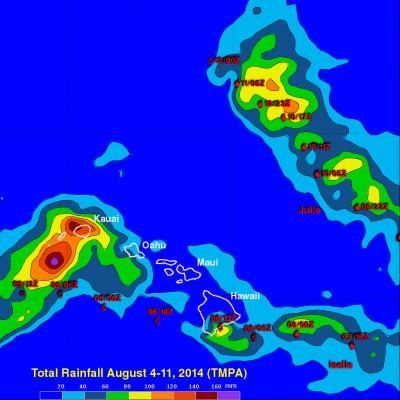
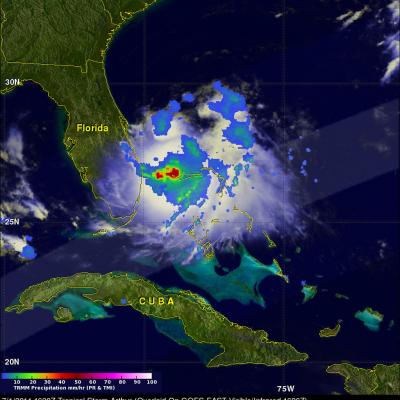
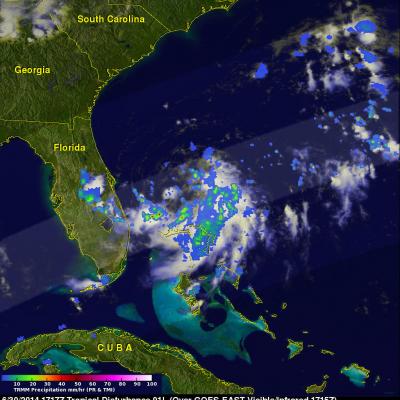
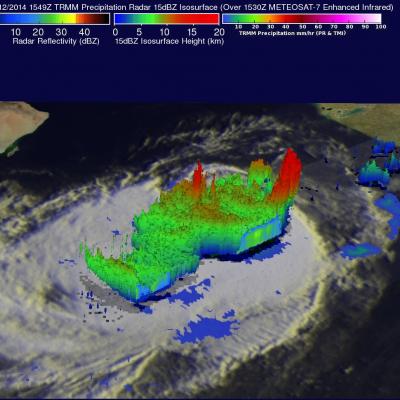
Strong winds and flooding associated with tropical storm Cristobal have caused deaths in the Dominican Republic, Haiti and Jamaica. Rainfall data for the first image above was captured by the TRMM satellite on August 24, 2014 at 1150Z (7:50 AM EDT). Tropical depression four was upgraded to tropical storm Cristobal a short time after that TRMM view. The next image uses data received by TRMM a day later on August 25, 2014 at 1230 UTC ( 8:30 AM EDT). Cristobal was a sheared tropical cyclone with a rain free center so a red tropical storm symbol was used to clarify the location of Cristobal's

Tropical Storm Iselle Departs Hawaii While Julio Stays Well North

Iselle was once a rather powerful category 4 hurricane in the East Pacific with sustained winds estimated at 120 knots (~138 mph) by the National Hurricane Center. Fortunately, a combination of southwesterly wind shear, drier air and cooler waters weakened Iselle considerably as it approached the Hawaiian Islands. Although much weaker, Iselle still struck the southeast Kau coast of the Big Island of Hawaii as a rather strong tropical storm. In fact Iselle, was the strongest and only the 2nd tropical storm to hit the Big Island in over 50 years. The center made landfall around 2:30 am HST

Tropical Storm Iselle Hits Hawaii

Hurricane Iselle weakened to a tropical storm while approaching the island of Hawaii on Thursday August 7, 2014. As a tropical storm Iselle contained some heavy rain showers and strong winds when it hit the big island. Iselle later dropped some heavy rain over Maui and scattered showers extended to Kauai and Oahu. The TRMM satellite had an excellent view of tropical storm Iselle as it neared the Hawaiian islands on August 8, 2014 at 0152 UTC ( August 7 at 3:52 PM HST). A rainfall analysis from TRMM's Microwave Imager (TMI) and Precipitation Radar (PR) instruments is shown overlaid on a 0200

Tropical Storm Julio Following Iselle's Track

The hurricane season in the eastern Pacific Ocean has been very active this year. Eleven named tropical cyclones have already formed in the eastern Pacific Ocean. Tropical storm Julio that formed yesterday is following almost the same path as hurricane Iselle toward the central Pacific and the Hawaiian Islands. The TRMM satellite flew over tropical storm Julio on August 5, 2014 at 0944 UTC and collected data used in these images. The first image shows a rainfall analysis derived from TRMM's Microwave Imager (TMI) and Precipitation Radar (PR) overlaid on an enhanced GOES-WEST image received at

Atlantic Tropical Storm Bertha Forms

The National Hurricane Center (NHC) upgraded a well defined low pressure center east-southeast of Barbados to tropical storm Bertha on July 31, 2014 at 0300 UTC (11 PM AST). Bertha's development is inhibited by vertical wind shear that may weaken as the tropical storm moves over the northeastern Caribbean Sea. The TRMM satellite had an excellent view of tropical storm Bertha on August 1, 2014 at 0713 UTC (3:13 AM AST). Rainfall from TRMM's Microwave Imager (TMI) and Precipitation Radar (PR) with this TRMM pass is shown overlaid on a GOES-EAST enhanced infrared image received at 0715 UTC. Those

Tropical Storm Neoguri Soaks Southern Japan

Once powerful typhoon Neoguri is dropping copious rainfall as it passes over southern Japan as a tropical storm. Heavy rainfall from Neoguri fell on land that was already soaked earlier this month by a slow moving seasonal frontal system. Flooding and mudslides from Neoguri have caused the deaths of three people in Japan this week. The TRMM Multi-Satellite Precipitation Analysis (TMPA), produced at Goddard Space Flight Center, combines the rainfall estimates generated by TRMM and other satellites (3B42). The analysis above shows a near-real time Multi-satellite Precipitation Analysis (TMPA)

TRMM Sees Arthur Intensifying

Tropical storm Arthur intensified and was upgraded to a hurricane by the National Hurricane Center (NHC) early this morning. The TRMM satellite flew above the intensifying tropical storm on July 2, 2014 at 2156 UTC (7:56 PM EDT). At that time TRMM found that Arthur hadn't formed an eye but had heavy rain near the center of a well defined circulation. Rainfall derived from TRMM's Microwave Imager (TMI) and Precipitation Radar (PR) is shown overlaid on a GOES-EAST Visible/Infrared image collected at the same time as the TRMM pass.

TRMM Sees New Tropical Storm Arthur

The TRMM satellite had a good daylight look at tropical storm Arthur on July 1, 2014 at 1620 UTC (12:20 PM EDT) less than two hours after it was upgraded from a tropical depression. Rainfall from TRMM's Microwave Imager (TMI) and Precipitation Radar (PR) data are shown overlaid on a GOES-EAST infrared/visible image collected at 1626 UTC (12:26 PM EDT). The location of very heavy rainfall around Arthur's center was shown using TMI data. TRMM PR data sliced through the southern half of the tropical storm. A 3-D view (from the west) using those data is shown above. Radar reflectivity values

Arthur Becomes First Atlantic Tropical Storm

A tropical disturbance east of Florida's coast became better organized and was upgraded to a tropical depression by the National Hurricane Center (NHC) on June 30, 2014 at 11:00 PM EDT (July 1, 2014 at 0300 UTC). On July 1, 2014 at 1100 AM EDT (15:00 UTC) the NHC upgraded tropical depression one to tropical storm Arthur. The TRMM satellite had an excellent view of the forming tropical depression (TD01) on June 30, 2014 at 1717 UTC (1:17 PM EDT). Intense thunderstorms were shown by TRMM to be wrapping around the southern side of the low pressure center. TRMM's Precipitation Radar (PR) revealed

Arabian Sea Tropical Storm Nanauk

Tropical storm NANUAK formed west of India on June 10, 2014 and since then has been moving toward the northwest over the open waters of the Arabian Sea. The TRMM satellite found that NANAUK contained powerful storms dropping rain at a rate of over 247.3 mm/hr (about 9.7 inches) when viewed on June 11, 2014 at 1549 UTC. An analysis of rainfall from TRMM's Microwave Imager (TMI) and Precipitation Radar (PR) is shown above overlaid on a 1530 UTC enhanced infrared image from the METEOSAT-7 satellite. TRMM PR data were used in the 3-D view shown in the second image. Those data showed that NANAUK