GPM

GPM content

GPM Examines Tropical Depression Bonnie In The Carolinas

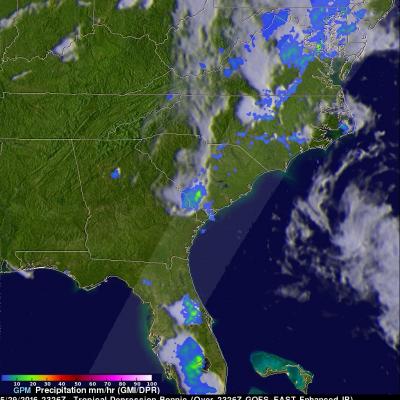
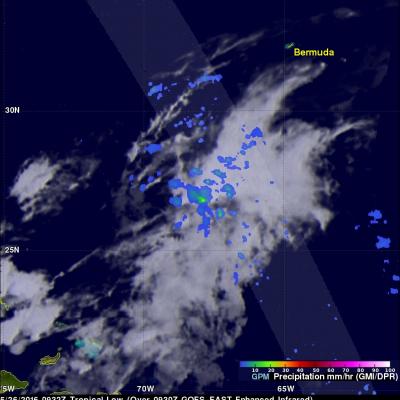
The GPM core observatory satellite had an excellent view of Tropical Depression Bonnie as it flew over the southeastern United States on May 29, 2016 at 2326 UTC (7:26 PM EDT). Rainfall was analyzed using data collected by GPM's Microwave Imager (GMI) and and Dual-Frequency Precipitation Radar (DPR) instruments. GPM's radar (DPR) showed rain falling at a rate of over 25.4 mm (1 inch) per hour in South Carolina. GPM's Radar (DPR Ku Band) was able to see through cloud cover in the tropical depression and show the vertical shape of rain within storms. The heights of storm tops were derived from

Deadly Flooding Rainfall Over Texas And Tropical Storm Bonnie Measured From Space

Heavy rainfall caused deadly flooding in southeastern Texas. At least 4 people have been killed and continuing rainfall is expected to cause historic flooding in that area. Meanwhile, dissipating Tropical storm Bonnie is soaking the South Carolina coast, southeastern North Carolina and eastern Georgia on this Memorial Day weekend. Some flooding is expected as dissipating tropical storm Bonnie's rainfall moves northeastward along the coast. This analysis of liquid precipitation from space was accomplished by using merged satellite rainfall data from the TRMM Multi-satellite Precipitation

GPM Sees Potential Atlantic Tropical Cyclone

An area of low pressure located in the Atlantic Ocean between Bermuda and the Bahamas is being monitored today for possible development into a tropical or subtropical cyclone. Shower activity has increased in the area. The National Hurricane Center (NHC) has advised interests along the southeastern coast of the United States to monitor the progress of this low. The GPM core observatory satellite flew over this showery area on May 26, 2016 at 0932 UTC (5:30 AM EDT). GPM's Microwave Imager (GMI) and and Dual-Frequency Precipitation Radar (DPR) instruments measured precipitation around the low
Creating Digital Hurricanes
Every day, scientists at NASA work on creating better hurricanes – on a computer screen. At NASA’s Goddard Space Flight Center in Greenbelt, Maryland, a team of scientists spends its days incorporating millions of atmospheric observations, sophisticated graphic tools and lines of computer code to create computer models simulating the weather and climate conditions responsible for hurricanes. Scientists use these models to study the complex environment and structure of tropical storms and hurricanes. Getting the simulations right has huge societal implications, which is why one Goddard...

Developing Tropical Storm Triggers Deadly Landslides in Sri Lanka

A storm does not have to be especially powerful in terms of its winds to be deadly. Such is the case with Tropical Cyclone 01B (TC 01B) in the Bay of Bengal. Despite only reaching minimal tropical storm intensity just this morning at 06 UTC 18 May 2016, the system has been responsible for dumping heavy rains in and around Sri Lanka and southern Indian over the past few days as it tried to organize itself in the southwestern Bay of Bengal. This set the stage for two massive landslides, which buried 3 villages in south central Sri Lanka. So far, although several hundred people have been rescued

New GPM NRT Swath Product Browser

With the GPM Version 04 Update, PPS is also rolling out an interactive GPM NRT Viewer. This tool displays NRT Level 1C GMI, Level 2A GPROF, and Level 2A DPR data as soon as it is available in the NRT archive on a three-dimensional globe. Fields such as brightness temperature and surface precipitation rate are available for visualization, comparison, and improved data acquisition decision-making. You may Leave it running continuously as data refreshes with each segment, or use the navigation dropdown to look at specific events and time periods from the previous twelve hours. This viewer is

F17 SSMIS L1C Data Product Update

Due to continuing, intermittent anomalies in the F17 SSMIS 37v channel, starting from April 13, 2016 (Orbit # 48713 : 18:29:36) and forward all 1C F17 products will flag the 37V channel as bad data and the Brightness Temperatures will be missing. We apologize for any inconvenience or problems that this may cause and appreciate your understanding and patience. Please let us know if you have any questions or concerns.

Recent IMERG Anomalies

Below are a few recent satellite anomalies of note that may have affected the quality of the IMERG precipitation products. 10 May 2016: The data flow from the Himawari-8 GEO satellite was interrupted for 57 hours, 7 May, 05 UTC – 9 May, 14 UTC and during that time there is a continuous zone of missing values in the IR precipitation data in the center of the Himawari-8 sector (over Japan), where data from the adjoining GEO satellites are unable to fill the gap. The IR-based displacement vectors were therefore computed using the standard fallback of spatial interpolation. 20 April 2016

PPS Experiencing Temporary Service Outage

UPDATE 5/10/16 1:06pm EDT: Access to PPS systems and services have been restored. Thank you for your patience during this period. Please report any problems; and do not hesitate to contact us if you have any questions or concerns. ----- The Precipitation Processing System (PPS) is currently experiencing a hardware problem which is impacting PPS data production, ftp archive access (arthurhou, trmmopen, etc.), and PPS web sites (STORM, THOR, etc.) today - Tuesday May 10,2016. Our system programmers are currently working on this problem and hope to restore services as soon as possible. We will

GPM Measures Deadly Flooding Rainfall

Over the past week extreme rainfall caused flooding that resulted in the deaths of four in Haiti and the evacuation of over 2500 people in the Dominican Republic. The GPM core observatory satellite saw a line of heavy rainfall on the eastern side of the Dominican Republic when it flew over on May 8, 2016 at 0428 UTC. GPM's Microwave Imager (GMI) and Dual-Frequency Precipitation Radar (DPR) instruments collected data that were used to estimate rainfall. This precipitation is shown on a top-down satellite view. Powerful storms were measured dropping rain at a rate of almost 300 mm (11.8 inches)