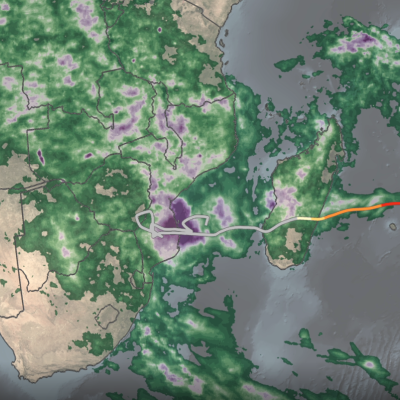
Logo for GPM Applications showing ecology, water and agriculture, energy, disasters, health, and weather.

Applications Articles

GPM overpass of Hurricane Nicholas
Although it only reached hurricane status for a brief period, Hurricane Nicholas made an impact on the northern Gulf Coast by bringing heavy rains to an area still recovering from the devastating effects of powerful Hurricane Ida, which made landfall in Louisiana just over 2 weeks earlier. Nicholas formed after a tropical wave passed over the Yucatan Peninsula and into the Bay of Campeche, providing a focus for shower and thunderstorm development. On the morning of Sunday September 12th, the National Hurricane Center (NHC) found that this area of storms had developed a closed circulation with
Hurricane Ida IMERG Totals
All eyes were on Hurricane Ida as it made landfall in Louisiana on Aug. 29, 2021, but many people were taken by surprise by the power of Hurricane Ida's remnants when they reached Virginia during the day on Sept.1 and New York City late at night on Sept. 1 into early morning on Sept. 2. The below animation shows the precipitation that fell during the entire lifecycle of Ida from before landfall in Louisiana through the impacts on New York City. Download this video (right-click -> "Save As") This animation uses data from the near real-time version of NASA's IMERG algorithm, a data product that
NASA/JAXA GPM Satellite Eyes Hurricane Ida Shortly Before Landfall
Hurricane Ida struck southeast Louisiana as a powerful Category 4 storm on Sunday, Aug. 29, 2021 - the 16th anniversary of Hurricane Katrina’s landfall in 2005. Ida brought destructive storm surge, high winds, and heavy rainfall to the region, and left over 1 million homes and businesses without power, including the entire city of New Orleans. The NASA / JAXA GPM Core Observatory satellite flew over the eye of Ida shortly before landfall at 10:13 a.m. CDT (1513 UTC), capturing data on the structure and intensity of precipitation within the storm. This animation shows NASA's IMERG multi
IMERG Precipitation Anomalies
Climate change impacts all of us in various ways. Changes in soil moisture have a pronounced effect on agricultural production, which in turn impacts the food we grow to eat. Changes in precipitation patterns are leading to increases in drought in certain regions and causing flooding in others. All of these impacts are influenced by interactions among processes within the Earth system involving the atmosphere, ocean, land, ice, and life. These natural interactions, combined with human influences such as the release of greenhouse gases, serve to drive the climate system resulting in distinct
GOES Model of Earth's Climate
Climate researchers around the world are taking advantage of NASA satellite observations to help inform, improve, and enhance climate models. NASA data helps to predict the future of Earth's climate and improve the predictive capability of models. This gives decision-makers the tools they need to make better decisions on how we live, including understand the changing impacts of hurricanes and improving predictions of fire seasons. But how exactly does NASA data support climate modeling activities, and how does the data improve these models? We’re here to explain the inner workings of how NASA
GPM DPR overflight of Hurricane Henri 22 Aug 2021
In the North Atlantic, the tropical system known as Henri reached hurricane status on Saturday, August 21, 2021. At the time, it was approaching a landfall in New England. Between Friday and Sunday, Henri was observed three times by the Dual-frequency Precipitation Radar (DPR) on the core satellite of NASA's Global Precipitation Measurement (GPM) mission. The GPM satellite's first two flyovers of Henri occurred just 10 hours apart and revealed a remarkably unchanging structure that was being impacted by wind shear. A third overflight occurred a day later, when wind shear had abated and Henri
GPM Overpass of Tropical Cyclone Fred on August 16, 2021.
Tropical Storm Fred, the 6th named storm of the 2021 Atlantic hurricane season, began as a westward moving disturbance in the central Atlantic east of the Lesser Antilles. The system passed through the southern Leeward Islands during the early morning hours of August 10 but still lacked a well-defined center of circulation. Despite significant thunderstorm activity within the system, it wasn’t until late that evening, when the system was passing just south of Puerto Rico, that the National Hurricane Center (NHC) identified a well-defined circulation and upgraded the system to Tropical Storm
IMERG precipitation over China for July 17 to 28, 2021
During July 17 to 28, 2021, several storm systems brought heavy rain to parts of China and surrounding countries, while a nine-month-long drought persists in an adjacent part of China. NASA's multi-satellite precipitation algorithm has been monitoring this rainfall in near real-time, and the estimates are distributed to weather-forecasting agencies and disaster-monitoring organizations. This algorithm is called IMERG , the Integrated Multi-satellitE Retrievals for GPM. GPM is the NASA / JAXA Global Precipitation Measurement mission , which launched its Core Observatory satellite in 2014. Two
IMERG analysis of monsoon rainfall in India, July 2021
After a relatively quiet period of below normal activity that began in the latter part of June and extended into the first half of July, and which resulted in rainfall deficits over much of India, the South Asian monsoon surged to life last week, bringing heavy rains, widespread flooding and landslides. Among the hardest hit areas was the western state of Maharashtra, which extends from the central west coast of India inland. A key geographical feature along the west coast of India is the Western Ghats. This coastal mountain range runs roughly north-south for about 1000 miles along the west
Arizona GPM DPR Convective Storm 3D View 2021 July 15
There is a monsoon that occurs in the southwestern U.S. each summer, and it brought heavy rain to the deserts of Arizona this week. This monsoon is less well known than India's Summer Monsoon, but both monsoons have similar causes [1, 2, 3]. In western Mexico and the southern edge of the southwest U.S., most of the year's rain typically falls in just three months: June, July, and August. The region is shown in light blue in the below climate map, which shows where summer rainfall predominates (Figure 1). This seasonal pattern is known as the North American Monsoon. The map was generated using

Hide Date