


GPM Finds Sheared Hurricane Jose Has Very Tall Storms
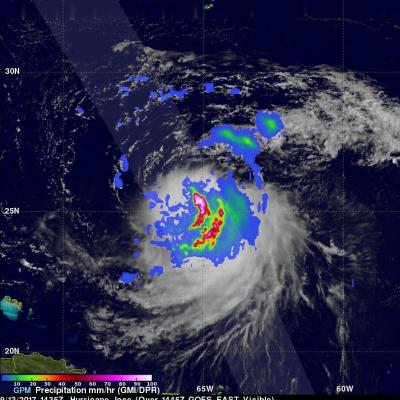
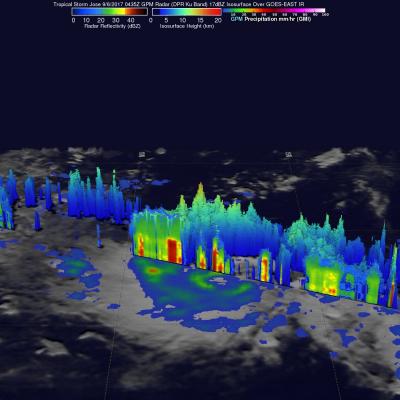
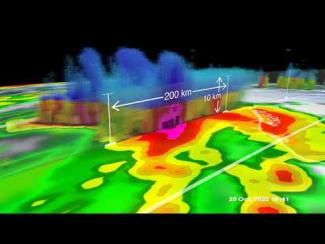
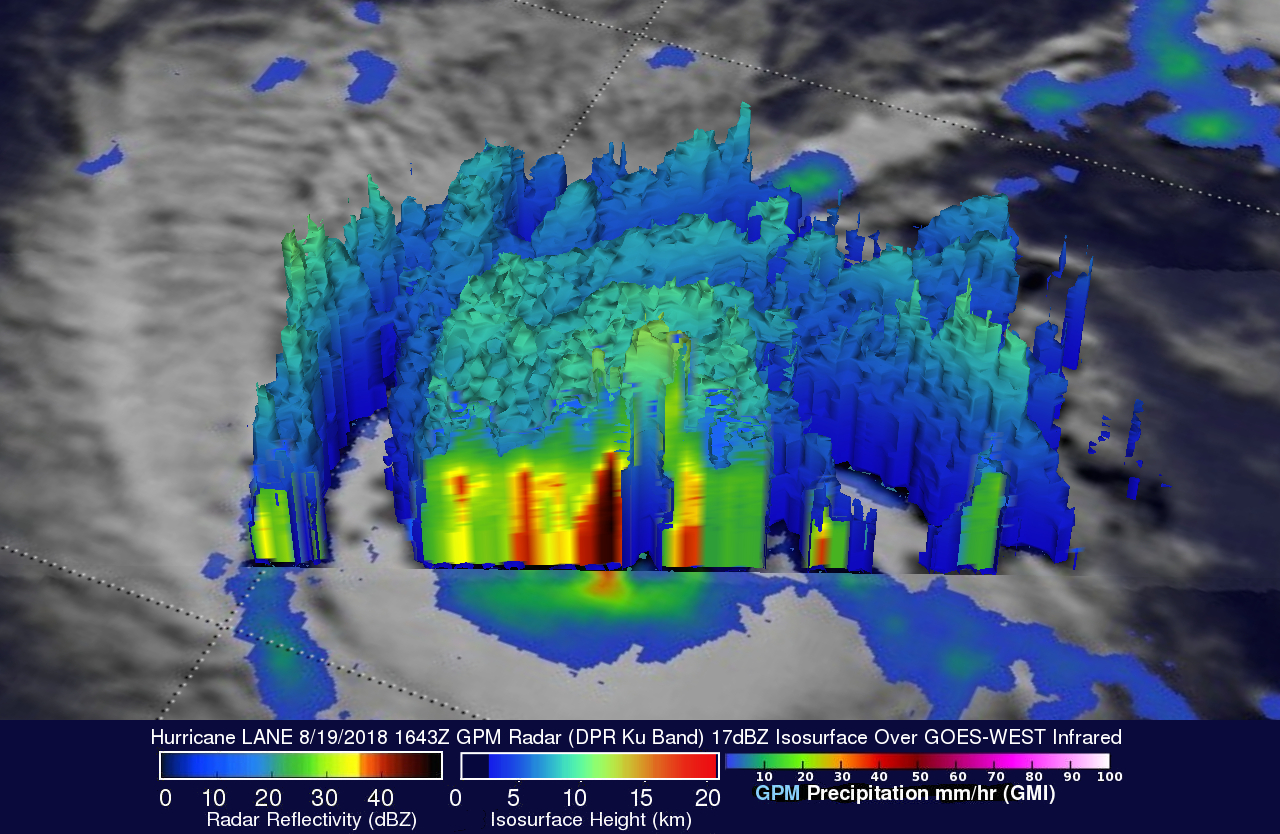
On Wednesday September 13, 2017 at 10:35 AM AST (1435 UTC) the GPM core observatory satellite traveled above persistent hurricane Jose as it was meandering in the Atlantic Ocean. GPM found that even though Jose was affected by strong northwesterly shear it contained very powerful convective storms. GPM's Dual-Frequency Precipitation Radar (DPR) found extremely intense downpours within these storms where rain was measured by DPR falling at a rate of over 8.9 inches (227 mm) per hour. GPM's radar (DPR Ku Band) was used to show a 3-D cross-section of the precipitation within hurricane Jose. This