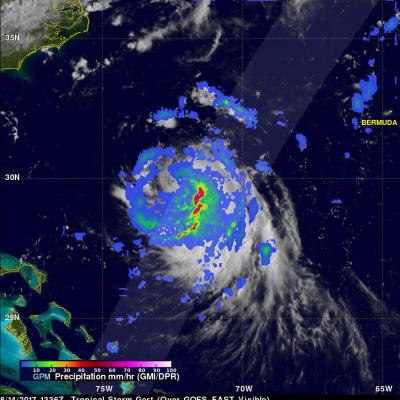


GPM Sees Gert Approaching Hurricane Intensity
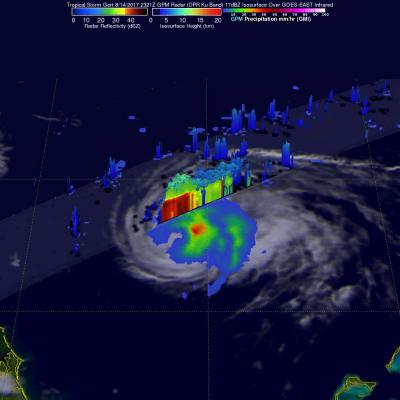
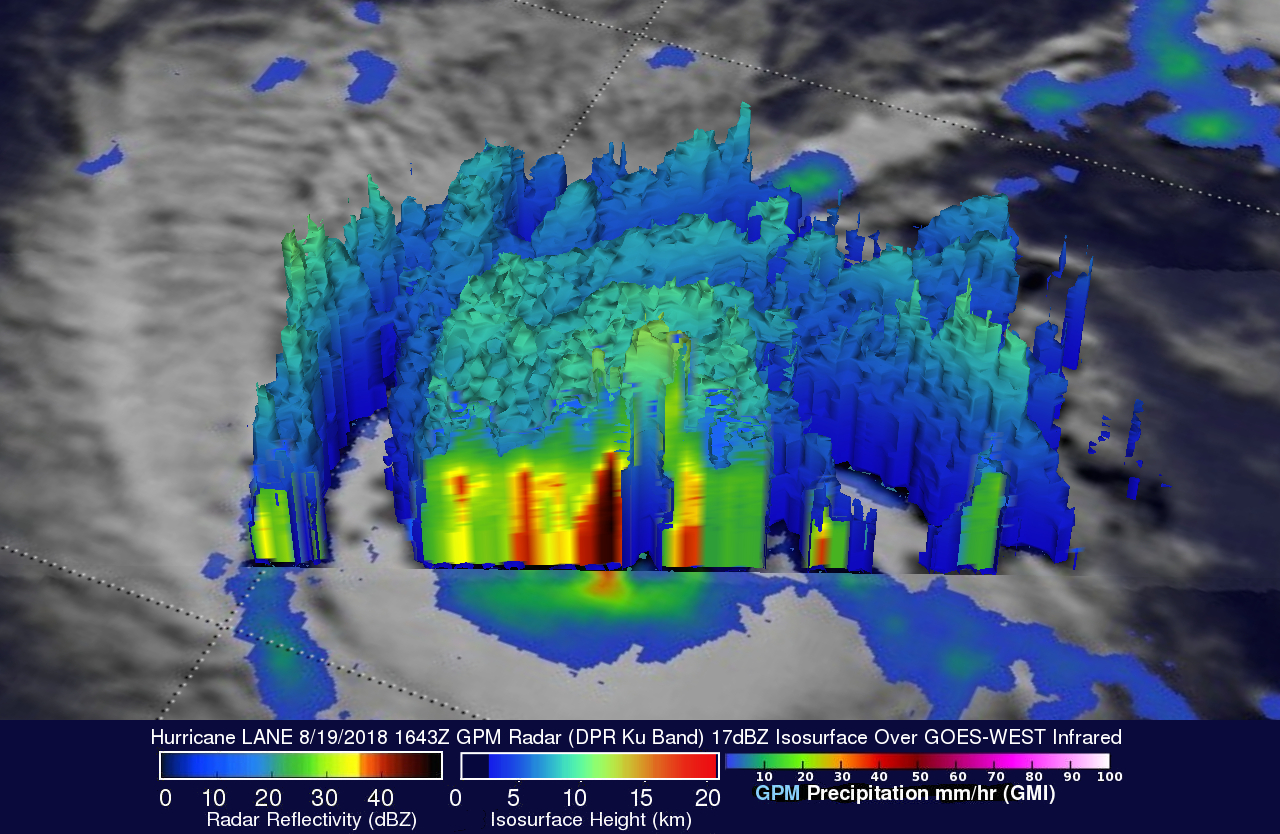
Tropical storm Gert was upgraded to a Hurricane on 1100 PM EDT Monday August 14, 2017 at 11:00 PM (August 15, 2017 0300 UTC). The GPM core observatory satellite flew over the intensifying tropical storm on August 14, 2017 at 7:21 PM EDT (2321 UTC). With winds of about 69 mph (60 kts) Gert was getting close to hurricane intensity. Data collected by GPM's Microwave Imager (GMI) and Dual-Frequency Precipitation Radar (DPR) instruments showed heavy rainfall south of Gert's partial eye. GMI showed that rain was falling at a rate of over 1.6 inches (40 mm) in that area. GPM's Radar scanned through