


GPM Sees More Powerful Tropical Cyclone Zena
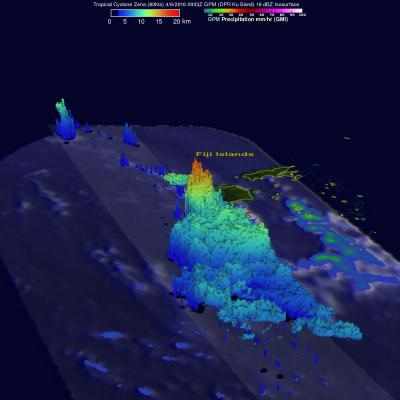
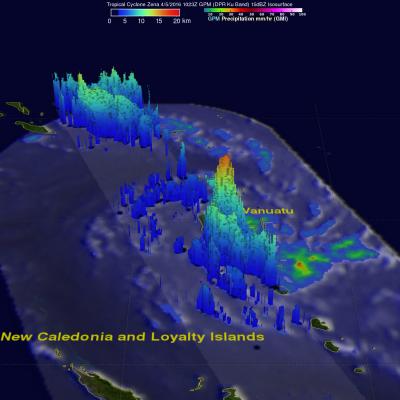
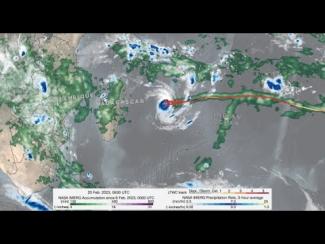
Tropical cyclone Zena intensified over the open waters between Vanuatu and Fiji. At peak intensity Zena had sustained winds estimated at about 90 kts (104 mph). The GPM core observatory satellite had an excellent view of tropical cyclone Zena on April 6, 2016 at 0933 UTC when tropical cyclone Zena was located southwest of Fiji. Zena had started to weaken but still had maximum sustained wind speeds estimated at 80 kts (92 kts). An analysis of GPM's Microwave Imager (GMI) and Dual-Frequency Precipitation Radar (DPR) data revealed the intensity of some very heavy showers in the tropical cyclone