


Intensifying South Pacific Tropical Cyclone Winston Viewed By GPM
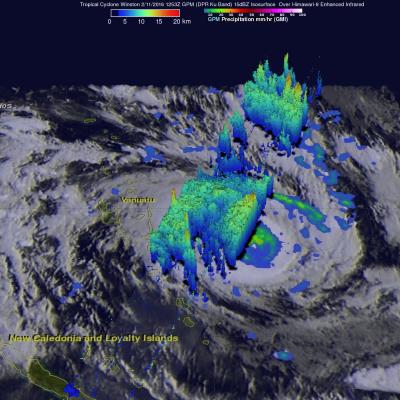
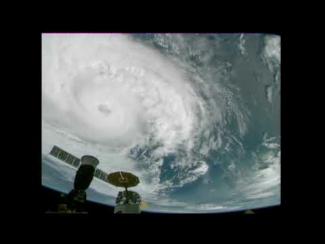
Tropical cyclone activity has recently increased in the South Pacific Ocean. Four tropical cyclones have formed in this area in 2016. The GPM core observatory satellite had an excellent view of tropical cyclone Winston on February 11, 2016 at 1253 UTC. Winston was located east of Vanuatu with tropical storm force winds of about 55 kts when GPM passed over head. Winston's rainfall was measured by GPM's Microwave Imager (GMI) and Dual-frequency Precipitation Radar (DPR) instruments. GPM's radar data revealed that Winston was dropping rain at a rate of over 60 mm (2.4 inches) per hour on the