

Intensifying Tropical Low Threatens Western Australia
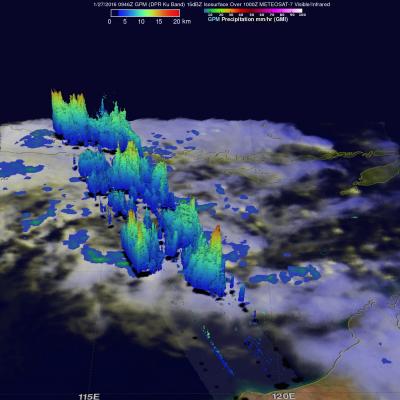
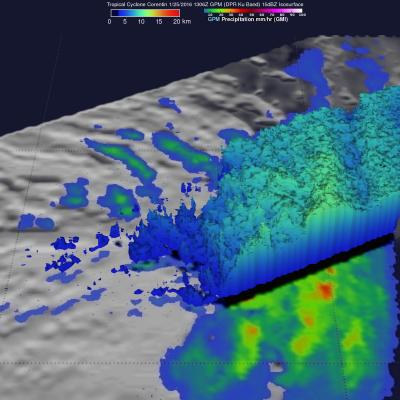
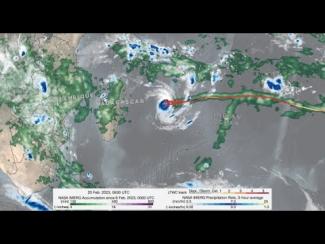
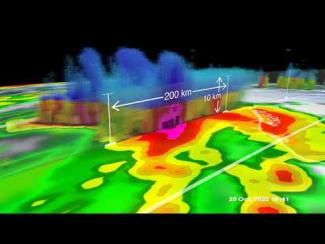
So far this year, no tropical cyclones have formed near Australia. A tropical low is now getting better organized in the Indian Ocean off Australia's northwestern coast. The GPM core observatory flew over this area of disturbed weather on January 27, 2016 at 0946 UTC. GPM's Dual-frequency Precipitation Radar (DPR) instrument measured rain falling at a rate of 96.7 mm (3.8 inches) per hour in towering convective storms within spiraling bands around the tropical low. GPM's Radar (DPR Ku band) made 3-D measurements of convective storm top heights. Some storm tops were found to reach altitudes of