


Weakening Tropical Storm Olaf Examined By GPM
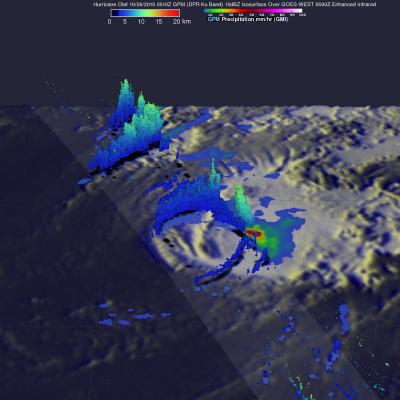
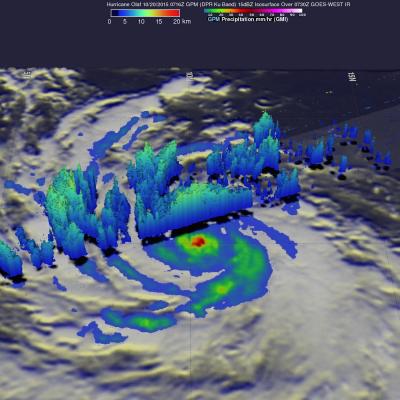
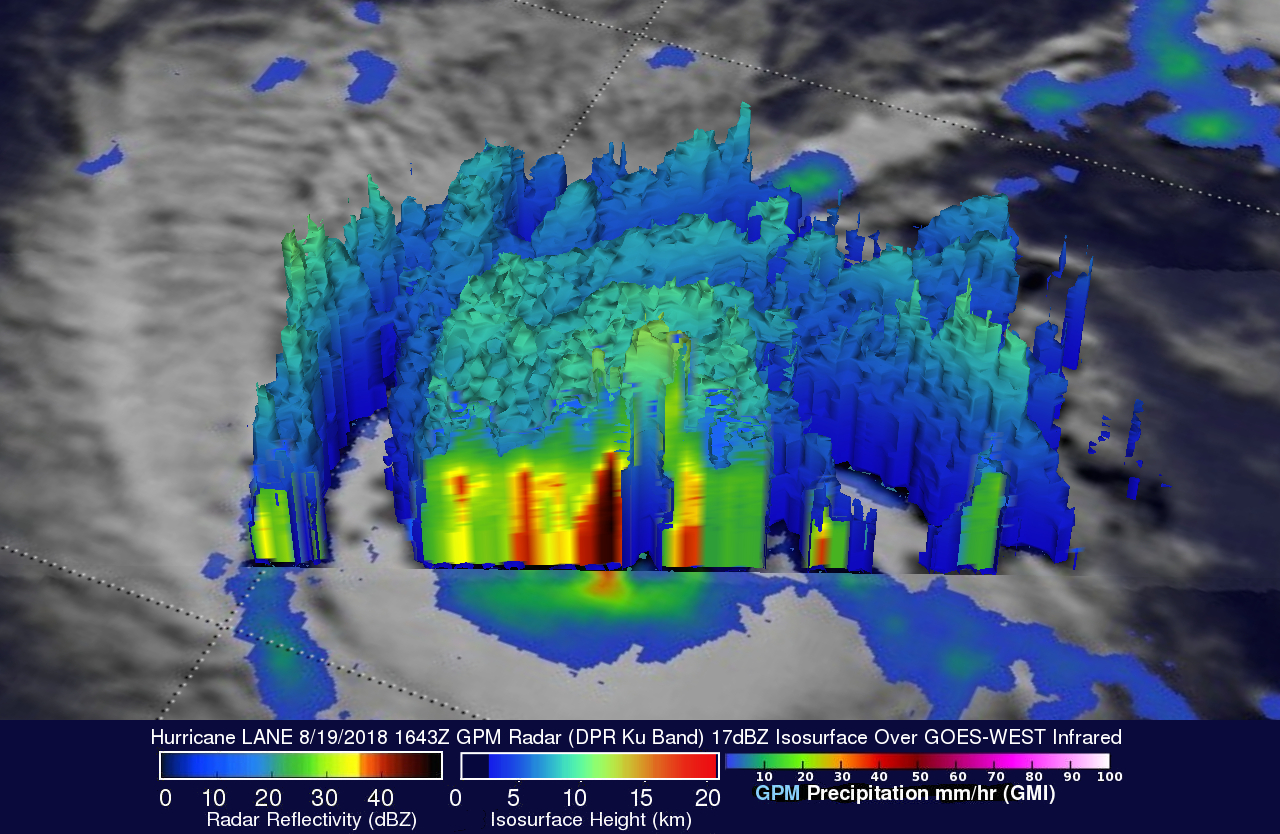
After maintaining hurricane intensity for over a week former category four hurricane Olaf is now a weakening tropical storm. The GPM core observatory satellite flew above Olaf on October 26, 2015 at 0510Z. Rainfall derived from data collected by GPM's Microwave Imager (GMI) and Dual-Frequency Precipitation Radar (DPR) instruments is shown here. Olaf had moved over cooler waters that were sapping the tropical cyclone's energy. GPM's GMI found that storms located in a small area within Olaf were still dropping rain at a rate of over 65 mm (2.6 inches) per hour. GPM's radar (DPR Ku band) sliced