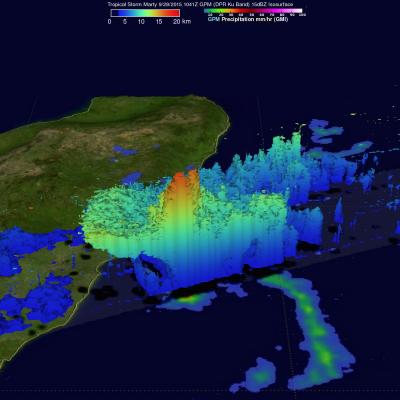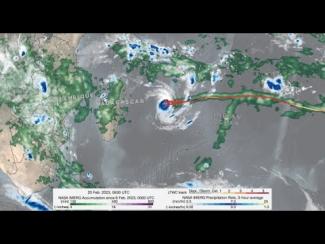


Tropical Storm Joaquin forms in the Western Atlantic
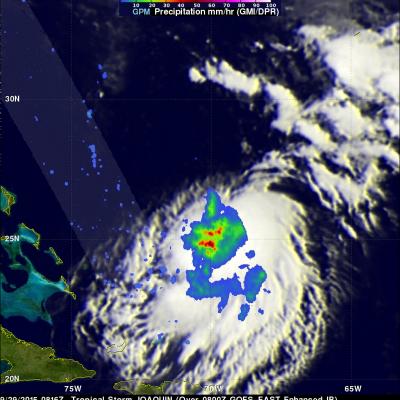
Tropical Storm Joaquin became the 10th named storm of the season after forming late last night (EDT) in the western Atlantic midway between the Bahamas and Bermuda from what was previously a tropical depression (#11), which itself had formed a day earlier from an area of low pressure that had been lingering in the region since Saturday. GPM captured this image of Joaquin early this morning at 8:16 UTC (4:16 am EDT) on the 29th of September as the storm was slowly drifting westward about 390 miles east of the northern Bahamas. The image shows rain rates derived from the GPM GMI (outer swath)