


Intensifying Atsani Viewed By GPM
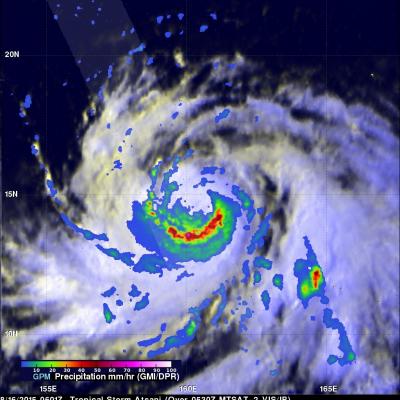
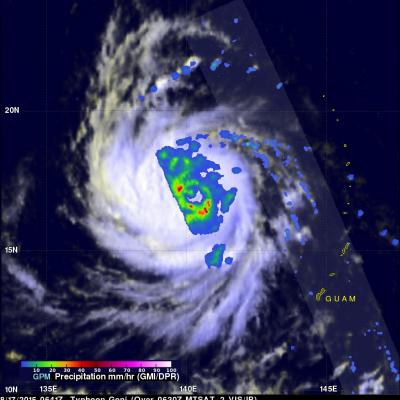
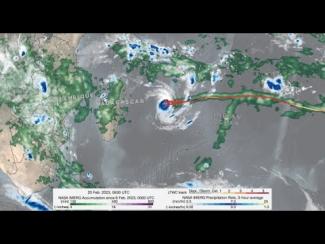
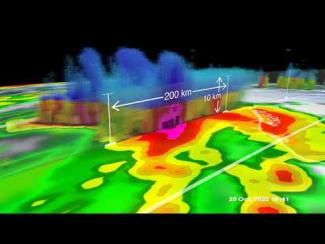
Atsani is a typhoon today but was an intensifying tropical storm moving over the open waters of the Pacific Ocean on August 16, 2015 when the GPM core observatory satellite flew above at 0601 UTC. An analysis of precipitation derived from GPM's Microwave Imager (GMI) and Dual-Frequency Precipitation Radar (DPR) instruments is shown overlaid on a 0600 UTC MTSAT-2 visible infrared image. This analysis revealed that very heavy rain that was located south of the storm's center of circulation. Rain there was found to be falling at a rate of over 90 mm (3.5 inches) per hour. A simulated 3-D view of