


GPM Sees Typhoon Soudelor On Taiwan's Doorstep
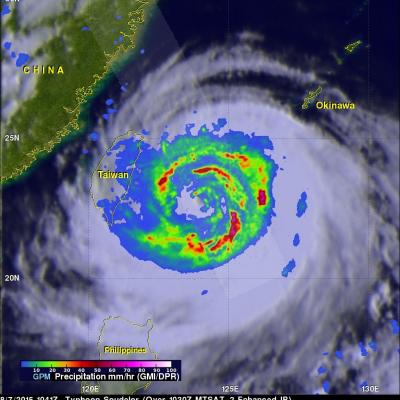
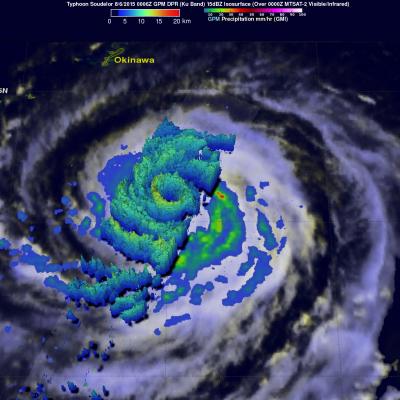
The GPM core observatory satellite continued to provide excellent coverage of Soudelor as the typhoon closed in on Taiwan. GPM flew directly above typhoon Soudelor's eye on August 7, 2015 at 1041Z (6:41 PM Local Time) when wind speeds were 110 kts (127 mph). Rainfall data from GPM's Microwave Imager (GMI) and Dual-Frequency Precipitation Radar (DPR) instruments revealed very heavy rainfall in spiraling bands rotating around a decaying inner eye wall. Precipitation intensity can be measured by the Dual-Frequency Precipitation Radar instrument mounted on the GPM core observatory satellite. Some