


IMERG Sees Heavy Rain Over United States
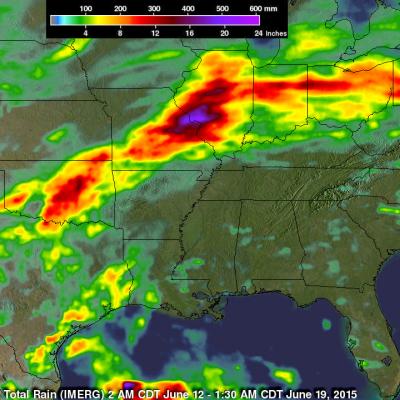
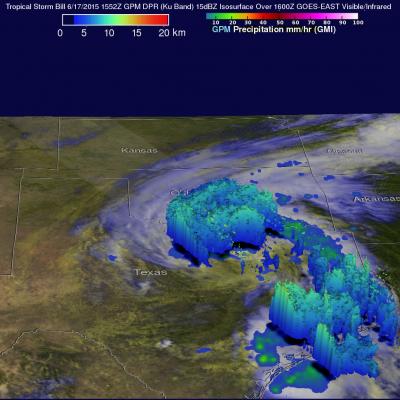
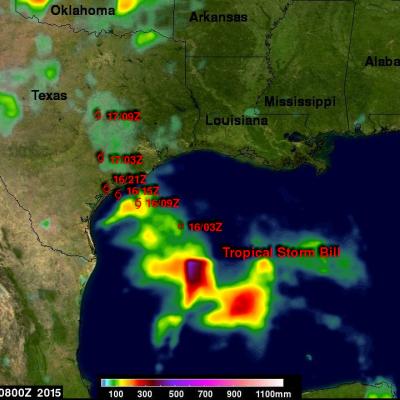
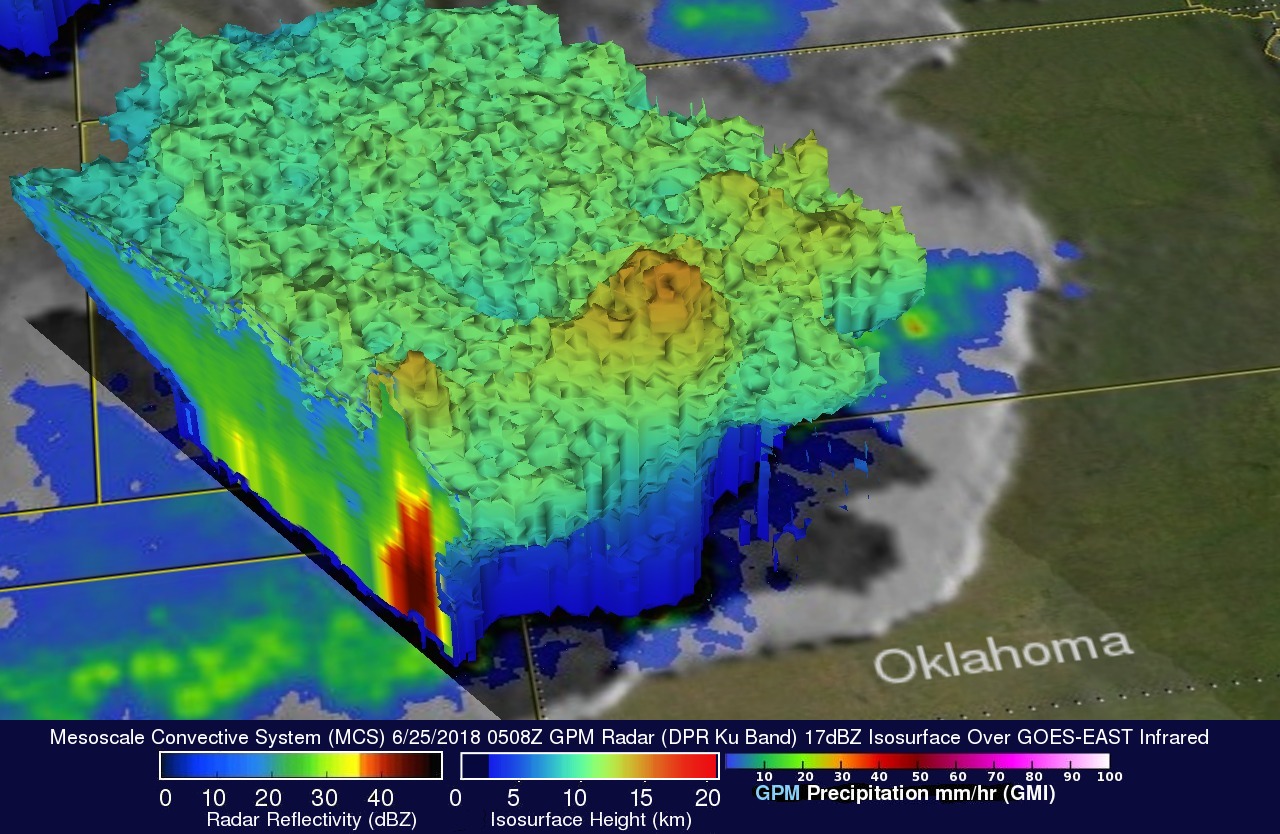
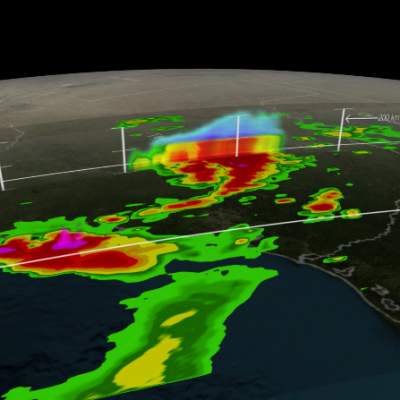
During the past week the combination of tropical storm Bill's landfall and a slowly moving frontal system extending from the Midwest to the Northeastern states dropped extreme rainfall from Texas' Gulf coast to the northeastern states. Data from NASA's Integrated Multi-satellitE Retrievals for GPM (IMERG) were used in this analysis to estimate the extreme amount of rain that fell during the past seven days. Tropical Storm Bill and it's remnants caused very heavy rainfall while moving through Texas and Oklahoma. Over a foot of rain was reported in Oklahoma resulting in at least two deaths. The