


NASA Sees Heavy Rainfall in Tropical Storm Halola
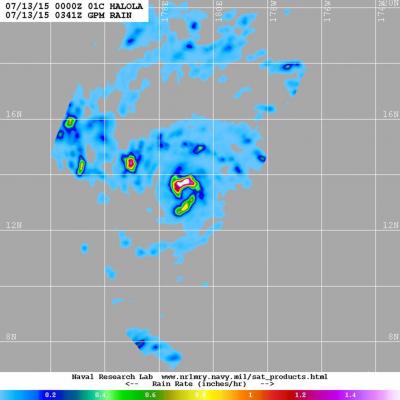
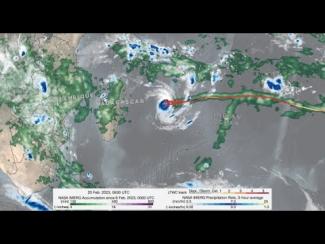
The GPM satellite passed over Tropical Storm Halola in the northwestern Pacific Ocean and found heaviest rainfall occurring north of the center of circulation. Halola formed in the Central Pacific Ocean and moved into the Northwestern Pacific Ocean basin today, July 13. On July 13 at 1500 UTC (11 a.m. EDT) Tropical Storm Halola had maximum sustained winds near 60 knots (69 mph/111.1 kph). It was located near 14.5 North and 177.0 East, about 694 nautical miles (798 miles/1,285 km) east-southeast of Wake Island. Halola has tracked west-northwestward at 11 knots (12.6 mph/20.3 kph). The Global