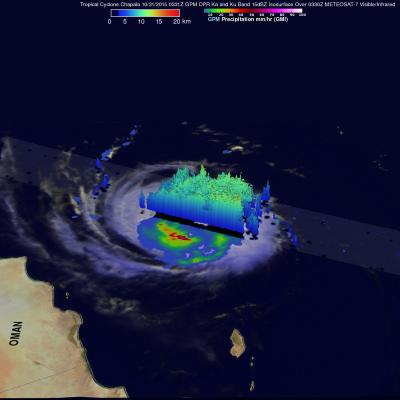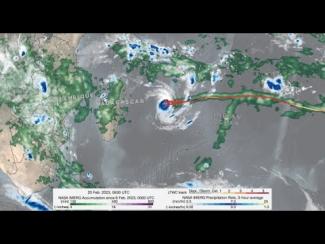


GPM Sees Tropical Cyclone Chapala Threatening Yemen
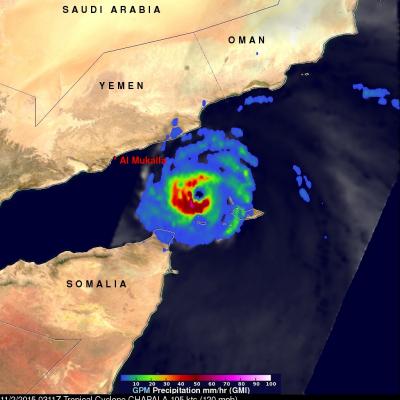
Tropical cyclone Chapala had entered the Gulf Of Aden when the GPM core Observatory satellite passed over on November 2, 1015 at 0311 UTC. Chapala still had maximum sustained winds estimated at about 105kts (121 mph) making it a category three tropical cyclone on the Saffir-Simpson hurricane wind scale. GPM's Microwave Imager (GMI) found that Chapala was dropping rainfall at a rate of over 65 mm (2.6 inches) per hour in intense storms southwest of Chapala's well defined eye. The Joint Typhoon Warning Center (JTWC) predicts that Chapala will weaken before landfall. Chapala is expected to have