Tropical Storm Imelda Brings Flooding Rain To Texas
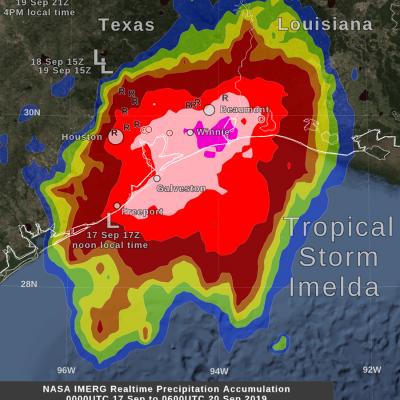
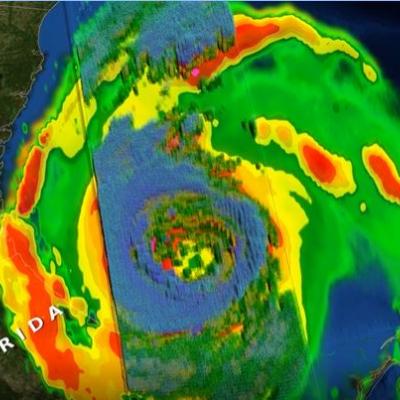
By Friday morning, September 20, the rainfall from the remnant of Tropical Storm Imelda had increased to over 24 inches in some areas near the Gulf of Mexico coast between Beaumont and Houston, Texas. This rainfall was in excess of what had been forecasted a few days earlier and was due to Imelda's forward motion ceasing for approximately 24 hours between Wednesday and Thursday afternoon. The image shows, with large "L" symbols, the location estimated by the National Hurricane Center for Imelda's low-pressure center of rotation at various times over the past three days. This near-realtime rain