Logo for GPM Applications showing ecology, water and agriculture, energy, disasters, health, and weather.

Applications


Image

Overview

The Global Precipitation Measurement (GPM) mission has several cross-cutting application areas which contribute to and enhance our understanding of weather forecasting, disasters, ecology, health, water and agriculture and energy. Using advanced space-borne instruments, GPM measures light rain to heavy rain and falling snow, producing a near-global view of precipitation every 30 minutes. Through improved measurements of rain and snow, precipitation data from the GPM mission is used by a diverse range of applications and user communities at local to global scales to inform decision making and policy that directly benefits society. 

Sections

What are Applications? 

“Applications” refers to the use of mission data products in decision-making activities for societal benefit. Mission Applications take a satellite's data products and expands them into areas where they can help inform policy or decisions. 

Learn more about Applied Sciences at NASA

Who's Using GPM Data?

Learn about the different people and organizations that are using GPM and other NASA Earth data to help improve life around the world. 

View Articles

2022 GPM Mentorship Program


GPM Data for Decision Making

Are you using GPM satellite precipitation data in your work, or would you like to? Share your story with our team, or ask us any questions you may have using our contact form.

We also encourage you to get involved in GPM applications by attending an applications event or accessing the free and publicly available data in the data section of this site

  • Dalia Kirschbaum (NASA GSFC), GPM Mission Associate Deputy Project Scientist for Applications
  • Andrea Portier (NASA GSFC / SSAI), GPM Applications and Outreach Coordinator
  • Dorian Janney (NASA GSFC / ADNET), GPM Outreach Specialist
  • Jacob Reed (NASA GSFC / Telophase), GPM Web Developer

Applications Featured Resources

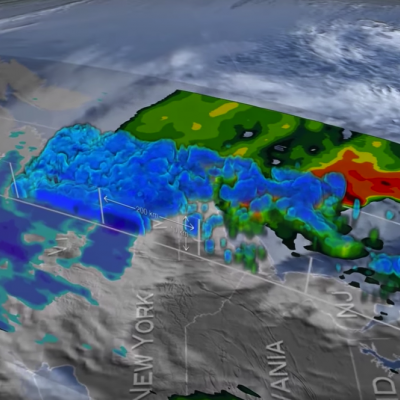
3D Views of February Snow Storms from GPM
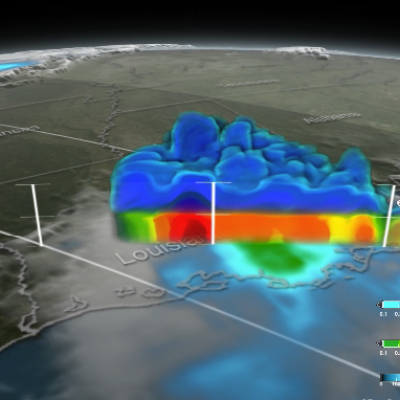
Download this video in HD formats from NASA Goddard's Scientific Visualization Studio The Global Precipitation Measurement (GPM) Core Observatory captured a 3-D image of a winter storm on Feb. 17, 2015, that left 6 to 12 inches of snow over much of Kentucky, southwestern West Virginia and northwestern North Carolina. The shades of blue indicate rates of snowfall, with more intense snowfall shown in darker blue. Intense rainfall is shown in red. The imagery shows great variation in precipitation types over the southeastern United States. Download this video in HD formats from NASA Goddard's...
Signs of Spring Spring Weather What is spring to you?  Spring around the world March 20 - launch of contest
At 5:05 p.m. EST Monday, Jan. 26, 2015, the Global Precipitation Measurement mission's Core Observatory flew over the Nor'easter that dumped snow on New England. This satellite image shows the rate of rainfall, with low amounts in green and high in red, and snowfall, in blue to purple. The center of the storm, shown in 3-D, was offshore with far reaching bands of snowfall. More intense snow rates are shown in darker blue, which can be seen on the northern edge of the storm. Visible in the 3-D image of the center of the storm are the snowy tops of the clouds in blue and underneath where it...
GPM Dissects Super Typhoon Hagupit
On December 5, 2014 (1032UTC) the Global Precipitation Measurement (GPM) mission's Core Observatory flew over Typhoon Hagupit as it headed towards the Philippines. A few hours later at 1500 UTC (10 a.m. EST), Super Typhoon Hagupit's maximum sustained winds were near 130 knots (149.6 mph/241 kph), down from 150 knots (172 mph/277.8 kph). Typhoon-force winds extend out 40 nautical miles (46 miles/74 km) from the center, while tropical-storm-force winds extend out to 120 miles (138 miles/222 km). Animation revealing a swath of GPM/GMI precipitation rates over Typhoon Hagupit. As the camera moves...
GPM Flies Over Hurricane Gonzalo
Download in Hi-Res from the Scientific Visualization Studio On October 16th, 2014 (1342 UTC) the Global Precipitation Measurement (GPM) mission's Core Observatory flew over Hurricane Gonzalo as it headed towards Bermuda. Hurricane Gonzalo remains a category 4 hurricane on the Saffir-Simpson Hurricane Scale, with maximum sustained winds at 130 mph. As of 12:00 UTC (8:00a.m. EDT) on Friday, October 17th, the National Hurricane Center forecast located the storm about 195 miles south southwest of Bermuda, where a hurricane warning is in effect. The GPM Core Observatory carries two instruments that...
GPM Scans Typhoon Phanfone
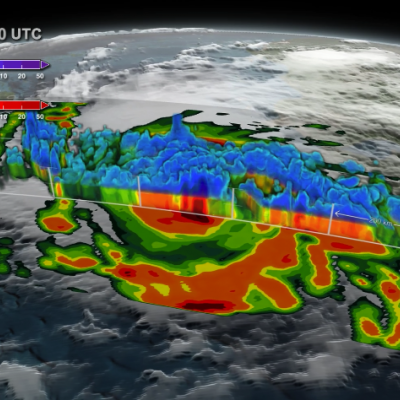
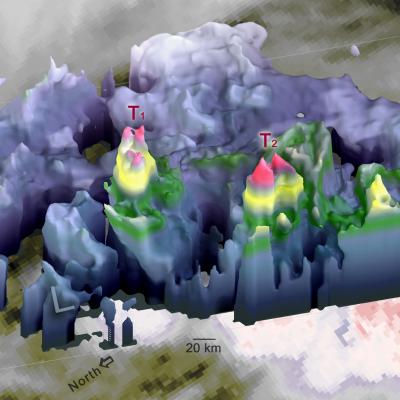
Animation revealing a swath of GPM/GMI precipitation rates over Typhoon Phanfone. The camera then moves down closer to the storm to reveal DPR's volumetric view of Phanphone. A slicing plane dissects the Typhoon from south to north and back again, revealing it's inner precipitation rates. Shades of blue indicate frozen precipitation (in the upper atmosphere). Shades of green to red are liquid precipitation which extend down to the ground. Download in Hi-Res from the Scientific Visualization Studio On October 6, 2014 (0215 UTC) the Global Precipitation Measurement (GPM) mission's Core...
GPM Uncovers Compact Eyewall in Hurricane Simon
Hurricane Simon appeared to be keeping a secret before it rapidly intensified on Oct. 4, but the Global Precipitation Measurement or GPM satellite was able uncover it. On Oct. 4 at 0940 UTC (5:40 a.m. EDT) observations by the Ku-band radar on the GPM satellite suggested that the Eastern Pacific Ocean's Hurricane Simon was hiding a very compact eyewall hours before the National Hurricane Center detected rapid intensification of Simon's surface winds. The GPM satellite was launched in February of this year and is managed by both NASA and the Japan Aerospace Exploration Agency. On Oct. 4 at 0940...
PMM Article Image
On September 26, the Global Precipitation Measurement (GPM) satellite flew over an extra-tropical cyclone whose center was approaching Norway. The Norwegian weather service reported that this storm brought gale-force winds to parts of Norway's coast and mountains (20 m/s in the mountains and 50 m/s just off-coast, late at night on September 26). Extra-tropical cyclones this strong or stronger are a regular feature of northern European winters. The particularly damaging ones are called "windstorms." Borrowing a page from hurricane forecasters, some weather agencies in affected countries name...
GPM Captures Hurricane Odile
​ ​ Animation revealing a swath of GPM/GMI precipitation rates over Hurricane Odile. The camera then moves down closer to the Hurricane to reveal DPR's volumetric view of Odile. As the camera rotates around the Hurricane, a slicing plane dissects Odile revealing it's inner precipitation rates closer to the eye. Shades of blue indicate frozen precipitation (in the upper atmosphere). Shades of green to red are liquid precipitation which extend down to the ground. On September 15, 2014 (15:11 UTC) the Global Precipitation Measurement (GPM) mission's Core Observatory flew over Hurricane Odile as...
GPM Satellite Sees First Atlantic Hurricane
Animation of NASA-JAXA's GPM satellite data of rain rates and internal structure of Hurricane Arthur on July 3 2014. Image Credit: NASA's Scientific Visualization Studio / JAXA Download the Hi-Res Video Here The Global Precipitation Measurement (GPM) Core Observatory flew over Hurricane Arthur five times between July 1 and July 5, 2014. Arthur is the first tropical cyclone of the 2014 Atlantic hurricane season. GPM is a joint mission between NASA and the Japan Aerospace Exploration Agency. The Core Observatory was launched Feb. 27 from Japan and began its prime mission on May 29, just in time...
Super Typhoon Haiyan Hits the Philippines
Super typhoon Haiyan, equivalent to a Category 5 hurricane on the US Saffir-Simpson scale, struck the central Philippines municipality of Guiuan at the southern tip of the province of Eastern Samar early Friday morning at 20:45 UTC (4:45 am local time) as an extremely powerful super typhoon, perhaps the strongest ever recorded at landfall, with sustained winds estimated at 195 mph (315 kph) by the Joint Typhoon Warning Center. Previously, Hurricane Camille, which struck the northern Gulf Coast in 1969, held the record with 190 mph sustained winds at landfall. After striking Samar, Haiyan...

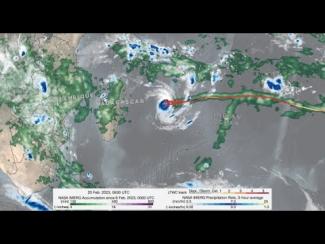
GPM IMERG precipitation rates and totals from Tropical Cyclone Freddy, Feb. 6 - March 12, 2023. Credit: NASA 

Download in high resolution from the NASA Goddard Scientific Visualization Studio

In a series of three half-day virtual meetings, this workshop will focus on current applications and future opportunities of NASA precipitation and cloud data products to support transport and logistical activities for aviation, maritime, roads and highway transportation systems. The workshop will bring together representatives from federal and state operational agencies and private companies to discuss how NASA precipitation and cloud products could be better leveraged to inform decision-making for transport and logistical operations. The workshop will also provide an opportunity for end...

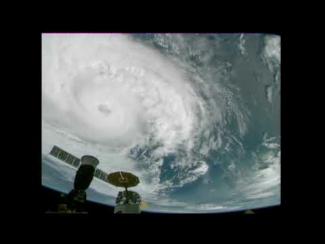
Cameras outside the International Space Station captured dramatic views of Hurricane Zeta at 12:50 pm ET October 28, as it churned 200 miles south-southwest of New Orleans packing winds of 90 miles an hour. Credit: NASA International Space Station

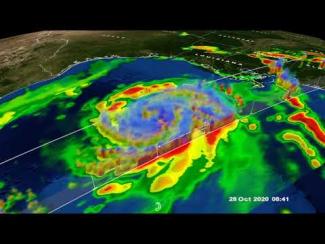
GPM Core Observatory overpass of Tropical Storm Zeta on October 28 at approximately 3:25am CDT (8:25 UTC). Credit: NASA Goddard Scientific Visualization Studio

View an interactive 3D visualization of this overpass in STORM Event Viewer

Hide Body

Hide Date

Hide Main Image

Hide Title