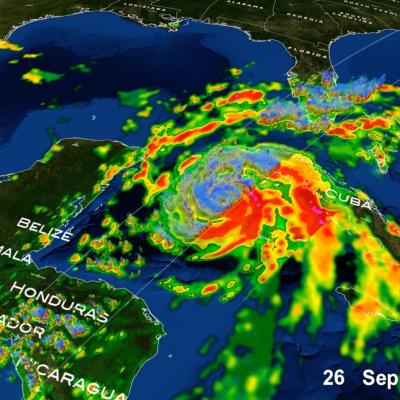
Articles

IMERG Rainfall Totals from Australian :"Rain Bomb" in March 2022
The below animation shows surface rainfall estimates from NASA’s IMERG multi-satellite precipitation product for the week starting on Feb. 22, 2022 at 0000 UTC and ending on Feb. 28, 2022 at 2330 UTC. Areas shaded in blue and yellow show three-hour average snapshots of IMERG rain rates every half-hour overlaid on cloudiness (shown in white/gray) based on geosynchronous satellite infrared observations. Below the rain rates and cloudiness data, IMERG rainfall accumulations are shown in green and purple. Tropical Cyclone Anika’s track is shown with a gray line based on data from the U.S. Navy-Air
GPM Overpass of Typhoon Surigae
Although it was only the 2nd named storm of the 2021 Pacific typhoon season, Typhoon Surigae became not only the first super typhoon of the season, but also the strongest tropical cyclone of 2021 worldwide. The majority of storms in the Northwest Pacific region form between June and Nov., but the season runs yearlong, as storms can form in any month in this region, which stretches from 100 degrees East to 180 degrees East, north of the equator. Surigae originated from an area of low pressure about 700 miles south of Guam. Persistent thunderstorm activity resulted in the formation of a tropical
MODIS imagery of the snowstorm in Jan. 2022
The Investigation of Microphysics and Precipitation for Atlantic Coast-Threatening Storms ( IMPACTS ) mission, now in its second year, is flying aircraft into snowstorms in order to improve meteorological models and our ability to use satellite data to predict how much snow will fall and where. NASA and its partners have several satellites that measure precipitation from space, such as the Global Precipitation Measurement (GPM) mission that observes rain and snow around most of the world every three hours. “But satellites can’t tell us a lot about the particles – the actual snowflakes ­– and
IMERG rainfall totals from the Nov. 2021 atmospheric river.
The Pacific Northwest coast saw two atmospheric rivers (ARs) bring heavy rains from Nov. 10-16, 2021, resulting in severe flooding, landslides, and damage to infrastructure in the British Columbia province of Canada. ARs are long, narrow corridors of water vapor that travel vast distances above the ocean from warm, tropical regions to higher latitudes, where they often release their moisture as rainfall when they reach land areas. While ARs occur across the globe, this year has been notable for several strong events that have impacted the Pacific Northwest coast. The two atmospheric rivers in
2021 average daily rainfall June, July August.
The Indian summer monsoon, also known as the southwest monsoon, falls within the South Asian monsoon and is the strongest and perhaps best-known of the world’s monsoons. During summer months when the Asian landmass heats up, warm, moist air flows northward from the Indian Ocean towards the Himalayas, bringing abundant showers and thundershowers to India. The summer monsoon is a regular event that occurs every year and is responsible for roughly 80% of India’s annual rainfall. The summer monsoon typically starts in early June, peaks in July and August and winds down during September and early