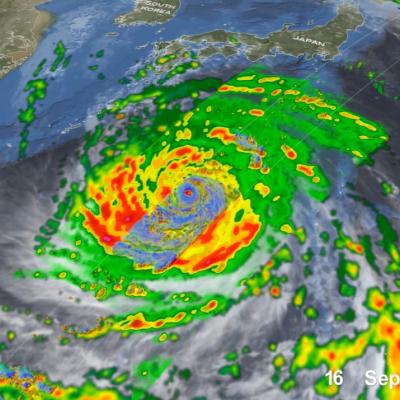
Articles

IMERG analysis of monsoon rainfall in India, July 2021
After a relatively quiet period of below normal activity that began in the latter part of June and extended into the first half of July, and which resulted in rainfall deficits over much of India, the South Asian monsoon surged to life last week, bringing heavy rains, widespread flooding and landslides. Among the hardest hit areas was the western state of Maharashtra, which extends from the central west coast of India inland. A key geographical feature along the west coast of India is the Western Ghats. This coastal mountain range runs roughly north-south for about 1000 miles along the west
Arizona GPM DPR Convective Storm 3D View 2021 July 15
There is a monsoon that occurs in the southwestern U.S. each summer, and it brought heavy rain to the deserts of Arizona this week. This monsoon is less well known than India's Summer Monsoon, but both monsoons have similar causes [1, 2, 3]. In western Mexico and the southern edge of the southwest U.S., most of the year's rain typically falls in just three months: June, July, and August. The region is shown in light blue in the below climate map, which shows where summer rainfall predominates (Figure 1). This seasonal pattern is known as the North American Monsoon. The map was generated using
Thumbnail
Climate change impacts all of us in various ways. Changes in soil moisture have a pronounced effect on agricultural production, which in turn impacts the food we grow to eat, and changes in precipitation patterns are leading to increases in drought in certain regions and causing flooding in others. All of which are influenced by interactions among components of Earth involving the atmosphere, ocean, land, ice, and life. These factors combine with long-term changes forced largely by human activities, such as the release of greenhouse gases, drive the climate system and result in distinct
IMERG Rainfall Totals from Cyclone Tauktae
NASA combined data from multiple satellites in the GPM Constellation to estimate precipitation rates and totals from Tropical Cyclone Tauktae in May 2021. The below animation shows precipitation rates (blue/yellow shading) and accumulations (green shading) at half-hourly intervals from May 12-19, 2021, derived from NASA's IMERG algorithm. Underneath the precipitation data, cloud cover is shown in shades of white/gray based on geosynchronous satellite infrared observations. On top of the precipitation data, the cyclone's approximate track is displayed based on estimates from the Joint Typhoon