Australia

IMERG Rainfall Totals from Australian :"Rain Bomb" in March 2022
The below animation shows surface rainfall estimates from NASA’s IMERG multi-satellite precipitation product for the week starting on Feb. 22, 2022 at 0000 UTC and ending on Feb. 28, 2022 at 2330 UTC. Areas shaded in blue and yellow show three-hour average snapshots of IMERG rain rates every half-hour overlaid on cloudiness (shown in white/gray) based on geosynchronous satellite infrared observations. Below the rain rates and cloudiness data, IMERG rainfall accumulations are shown in green and purple. Tropical Cyclone Anika’s track is shown with a gray line based on data from the U.S. Navy-Air
IMERG Precipitation Totals from Eastern Australia, March 16 - 23, 2021
During the week ending on March 23, 2021, two locations in Australia experienced unusually high rainfall totals. According to news reports a persistent system brought flooding rains to Australia's east coast from Brisbane to Sydney and points further south. The preliminary estimate from NASA's multi-satellite global precipitation analysis is that more than 24 inches fell just off the coast of Australia in 7 days with accumulations in coastal areas exceeding 16 inches. Near the Strzelecki Desert in central Australia, a storm system brought 8 inches of precipitation during the same 7-day period. Most of the rain fell during a 3-day period (0000 UTC on 20 March to 2359 UTC on 22 March).
IMERG rainfall totals from Australia in November 2019
Droughts and dry, arid conditions are naturally occurring phenomena in Australia. Such an environment is conducive to wild fires, which are started mainly by lightning and can occur throughout the year, but typically emerge between October and April and are most prevalent during the Southern Hemisphere summer; they are part of the seasonal cycle in Australia. However, some years are worse than others, and the 2019-2020 wild fire season was especially bad. It has been estimated that upwards of 46 million acres were burned, or roughly the size of the entire state of Washington. In terms of area...

GPM Shows Rainfall Southeast Of Sheared Tropical Cyclone Iris

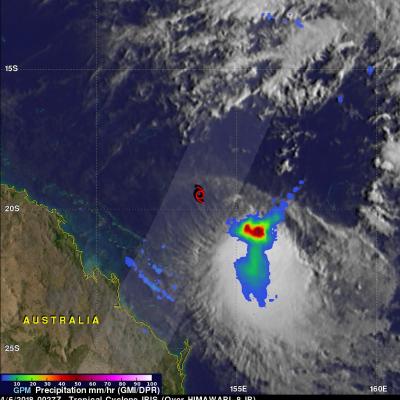
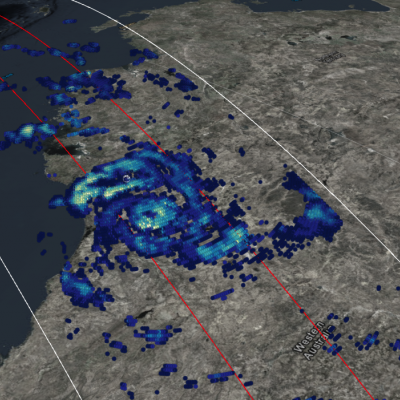
The GPM core observatory satellite again passed over the center of tropical cyclone IRIS on April 6, 2018 at 0027 UTC (10:27 AM AEST). The location of IRIS' low level center of circulation is shown here with a red tropical storm symbol. Data collected by GPM's Microwave Imager (GMI) revealed that heavy convective rainfall was sheared to the southeast of IRIS' surface center of circulation. Those GMI data showed that precipitation in that area of strong convection was falling at a rate greater than 59 mm (2.3 inches) per hour while data received by GPM's Dual Frequency Precipitation Radar (DPR)

GPM Satellite Probes Tropical Cyclone Iris Near Australian Coast

IRIS has taken a long, fluctuating and serpentine trek since the tropical cyclone formed in the Coral Sea northeast of Australia on March 24. For a while IRIS weakened and was downgraded to a tropical low. The tropical low moved toward the northeastern coast of Australia and was upgraded again to tropical cyclone IRIS on April 2. The tropical cyclone has then moved generally southeastward parallel to the Australian coast. This analysis from data collected by Microwave Imager (GMI) and Dual Frequency Precipitation Radar (DPR) instruments shows that extremely heavy rain was falling west of IRIS'

Tropical Cyclone Nora's Flooding Rains Measured With IMERG

Tropical Cyclone NORA produced heavy rainfall when it came ashore in northwestern Queensland on March 24, 2018 (GMT). NORA's peak intensity of 95 kts (109 mph) was reached when the tropical cyclone was located in the central northern Gulf Of Carpentaria. Winds had decreased slightly to 90 kts (104 mph) by landfall. The Australian Bureau of Meteorology (BOM) reported that NORA produced over 110 mm (4.3 inches) of rain in 24 hours. Flooding, landslides, lost electrical power, and structural damage were also a companion of the tropical cyclone's arrival. After landfall NORA weakened but the

GPM Sees Tropical Cyclone Kelvin Develop Cloudless Eye After Landfall in Australia

Tropical Cyclone Kelvin struck Northwestern Australia with winds reaching 54 knots as it crossed the Kimberley Coast. It brought flooding rains and damaging winds to the settlements and mining companies of the region. The storm intrigued meteorologists as it only developed a cloudless eye after making landfall, believed in part due to the heat flux generated by the warm desert the storm traveled over. View this visualization in full screen using STORM Event Viewer

Powerful Tropical Cyclone Irving Examined With GPM

Tropical cyclone Irving formed in the South Indian Ocean on January 6, 2018. Irving posed no threat to land because it orgininated over the open ocean far to the west of Australia. GPM's core observatory satellite had an excellent view of Irving's eye on January 2018 at 0706Z. The well defined rainfall patterns within Irving were clearly shown by GPM's Microwave Imager (GMI) and Dual Frequency Precipitation Radar (DPR) data. Very heavy rainfall was shown in the western side of Irving's large eye wall. GPM's Radar (DPR Ku Band) found rain in that side of the tropical cyclone falling at a rate

GPM Finds Heavy Rain In Short Lived Tropical Cyclone Hilda

Tropical cyclone HILDA formed very close to Australia's northwestern coast on December 27, 2017 at 1800 UTC and dissipated quickly as it crossed over land. The GPM core observatory satellite had a good view of the short lived tropical cyclone on December 27, 2017 at 2031 UTC. A red tropical storm symbol shows HILDA's approximate location when GPM passed above. The center of GPM's coverage was mainly east of HILDA's center of circulation. The intensity of rainfall in a large intense band of storms wrapping around the northeastern side of the tropical cyclone was measured by the satellite's

GPM Views Potential Australian Tropical Cyclone

On December 26, 2017 at 0806 UTC The GPM core observatory satellite satellite flew above northwestern Australia. GPM traveled over an area of convective thunderstorms in the Indian Ocean north of Australia's coast where a tropical cyclone is expected to develop. GPM's Microwave Imager (GMI) and Dual-Frequency Precipitation Radar (DPR) instruments collected data that showed heavy precipitation in storms off the Australian coast. GPM's radar (DPR Ku Band) showed that a few extremely powerful convective storms northwest of the Dampier Land coast were dropping precipitation at a rate of greater