Australia

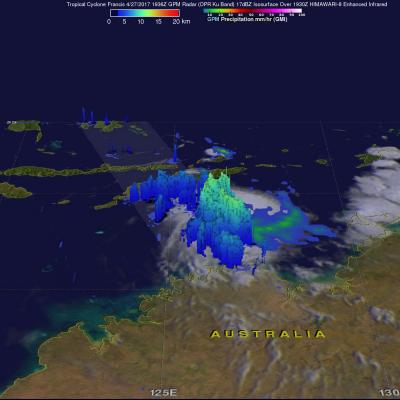
IMERG Sees Record Australia Rainfall

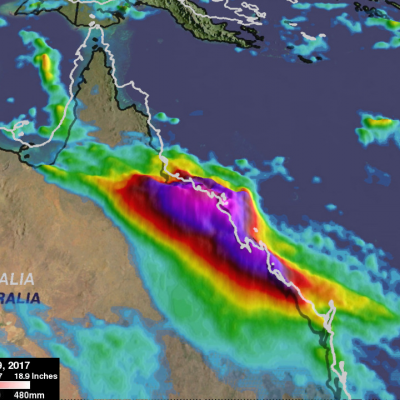
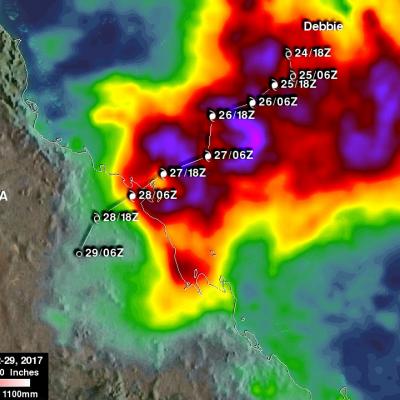
Over the past week extreme rainfall has drenched northeastern Australia. This is the heaviest rainfall in that area since tropical cyclone Debbie hit Queensland Australia in late March. Much of the recent extremely heavy rainfall was due to storms associated with a trough of low pressure slowly moving over northeastern Queensland from the Coral Sea. More than 100mm (3.9 inches) of rain in 24 hours was reported near Townsville in northern Queensland. A trough of low pressure moving eastward from central Australia has also been encroaching into western Queensland. This analysis of rainfall over

Intensifying Tropical Cyclone Francis Inspected By GPM

Tropical cyclone Francis formed north of Melville Island, Australia on April 27, 2017. Francis has been gradually intensifying while moving south-southwestward through the Timor Sea. Francis had maximum sustained winds estimated at 50 kts (57.5 mph) when the GPM core Observatory flew over on April 27, 2017 at 1936 UTC. The rainfall analysis shown here used data collected by GPM's Microwave Imager (GMI) and Dual-Frequency Precipitation Radar (DPR) instruments. DPR data indicated that strong convective storms near the center of the tropical storm were dropping rain at a rate of over 70 mm (2.8

GPM Observes Tropical Cyclone Forming North of Australia

The GPM Core Observatory satellite flew directly above a forming tropical cyclone in the Timor Sea northeast of Darwin, Australia on April 10, 2017 at 1146 UTC. Data collected by GPM's Microwave Imager (GMI) and Dual-Frequency Precipitation Radar (DPR) instruments showed that convective storms within the tropical low contained very heavy rainfall. GPM's DPR (Ku Band) data revealed that a line of intense storms west of the Bathurst and Melville islands was dropping rain at a rate of over 161 mm (6.3 inches) per hour. A 3-D examination of the forming tropical cyclone's cloud tops showed that
GPM Measures Tropical Cyclone Debbie
Tropical cyclone Debbie formed in the Coral Sea northeast of Australia om March 24, 2017. Debbie intensified and had hurricane force wind speeds within a day of formation. While headed toward northeastern Australia Debbie reached it's maximum sustained wind speeds estimated at over 100 kts (115 mph) on March 27, 2017 (UTC). Tropical cyclone Debbie came ashore on March 28th and brought destructive winds and extremely heavy rain to northeastern Australia. It was reported that heavy rainfall caused flash flooding that cut off a coastal town and covered several roads in Queensland. The GPM...

GPM Satellite Reveals Intensity Of Powerful Storms In The Timor Sea

The GPM satellite flew over a stormy area of the Timor Sea northwest of Australia on February 7, 2017 at 1926Z. GPM found that this stormy area contained some extremely powerful convective storms. GPM's Dual-Frequency Precipitation Radar (DPR) found that the most intense storms were dropping rain at a rate of over 268 mm (10.6 inches) per hour. Data received by GPM's Radar (DPR Ku Band) also revealed the 3-D anatomy of precipitation hidden inside these unusually powerful storms. GPM's radar found that these storm tops were pushing to altitudes greater than 19 km (11.8 miles). GPM radar data

GPM Sees Possible Tropical Cyclone Developing Near Australia

So far this year no tropical cyclones have developed in the Southwest Indian Ocean. The Joint Typhoon Warning Center (JTWC) recently warned that a low moving westward over northwestern Australia may soon become a tropical cyclone. Warm Indian Ocean waters and low vertical wind shear are providing a good environment for tropical cyclone development. The GPM satellite flew over northwestern Australia on January 25, 2017 at 2351 UTC. GPM's Microwave Imager (GMI) and Dual-Frequency Precipitation Radar (DPR) measured precipitation within strong convection in the Indian Ocean northwest of the lows

Intensifying Tropical Low Threatens Western Australia

So far this year, no tropical cyclones have formed near Australia. A tropical low is now getting better organized in the Indian Ocean off Australia's northwestern coast. The GPM core observatory flew over this area of disturbed weather on January 27, 2016 at 0946 UTC. GPM's Dual-frequency Precipitation Radar (DPR) instrument measured rain falling at a rate of 96.7 mm (3.8 inches) per hour in towering convective storms within spiraling bands around the tropical low. GPM's Radar (DPR Ku band) made 3-D measurements of convective storm top heights. Some storm tops were found to reach altitudes of

NASA IMERG Sees Australia's Bicoastal Rainfall

The rainfall accumulation analysis above was computed from data generated by the Integrated Multi-satellite Retrievals for GPM (IMERG) during the period from April 28 to May 3, 2015. During this period IMERG algorithms continuously merged and interpolated satellite passive microwave precipitation estimates and microwave-calibrated infrared (IR) satellite estimates over the entire globe. Rainfall from cyclone Quang fell over the west coast and a non-tropical system pounded the east coast of Australia simultaneously during the past weekend. Cyclone Quang formed in the South Indian Ocean

Cyclone Nathan Dissipates

The GPM core observatory satellite saw dissipating cyclone Nathan when it flew over Australia's Top End on March 24, 2015 at 0256 UTC. Nathan was shown dropping light to moderate rain after being cut off from moisture flowing from the Arafura Sea and the Gulf Of Carpentaria. The Joint Typhoon Warning Center (JTWC) predicts that Nathan will continue to weaken for the next few days while traveling westward over land.

Cyclone Nathan Circles Back

Cyclone Nathan located in the Coral Sea off Australia's Queensland coast has made another loop and is again headed slowly toward the Cape York Peninsula. Rainfall derived from the TRMM satellite's Microwave Imager (TMI) and Precipitation Radar (PR) instruments is shown with data collected on March 18, 2015 at 0758 UTC. The heaviest rainfall was measured by TRMM PR falling at a rate of over 119 mm (4.7 inches) on the eastern side of Nathan's eye. TRMM PR data were used in this 3-D view of cyclone Nathan. Storm heights in a rain band circling Nathan's northwestern side were found reaching