Australia

Tropical Cyclone Ita Drenches Australia

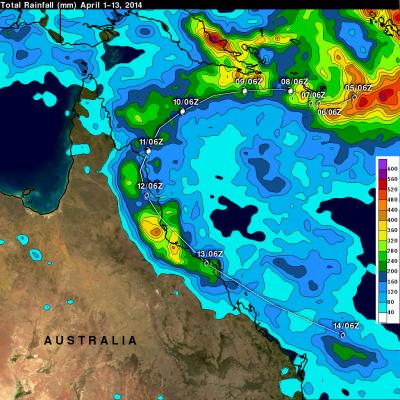
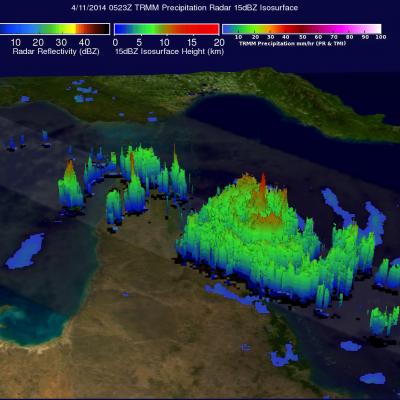
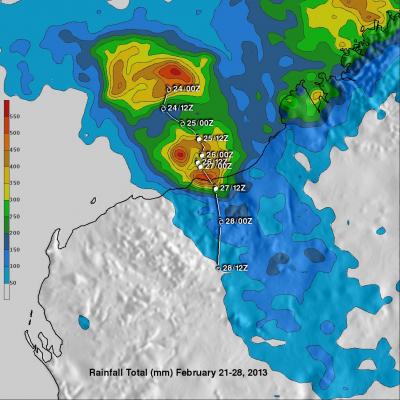
After coming ashore this past Friday tropical cyclone ITA dropped heavy rainfall over the weekend that caused flooding in many areas of northeastern Australia's state of Queensland. IDA has now moved back into the Coral Sea. The analysis above shows a TRMM-based near-real time Multi-satellite Precipitation Analysis (TMPA) made at the NASA Goddard Space Flight Center. This analysis used TMPA precipitation data from April 1-14, 2014 during the period when ITA formed in the Coral Sea and moved along northeastern Australia's coast. IDA's locations at 0600 UTC are shown overlaid in white. The

Powerful Tropical Cyclone Ita Hits Australia

As predicted, powerful tropical cyclone ITA hit the Queensland coast of northeastern Australia late Friday (local time). At that point ITA was a category four on the Saffir-Simpson hurricane intensity scale with winds estimated at over 120 kts (about 138 mph) . This intensity was down slightly from ITA's estimated peak sustained wind speed of 135kts (about 155 mph) when the dangerous tropical cyclone was approaching Australia. The TRMM satellite passed almost directly above as tropical cyclone ITA was approaching the Queensland coast on April 11, 2014 at 0523 UTC. At the time of this TRMM view

TRMM Sees Powerful Tropical Cyclone Ita Approaching Queensland, Australia

Tropical cyclone ITA, located in the Coral Sea northeast of Australia, continues to intensify while heading toward the northeastern coast of Australia. ITA was seen twice by the TRMM satellite on April 9, 2014. The tropical cyclone's wind speeds had increased from 65kts (about 75 mph) with the first pass at 0536 UTC to 80kts (about 92 mph) when viewed again at 1528 UTC. ITA is predicted to continue becoming more powerful and have sustained winds of 135 kts (about 188 mph) before hitting Australia's Queensland coast tomorrow. TRMM's Precipitation Radar (PR) instrument sliced through ITA's eye

High Level Of Tropical Cyclone Activity South Of The Equator

Tropical cylone activity has recently increased in the the Southern Hemisphere. On March 10, 2014 the TRMM satellite viewed three tropical storms within two hours. The images above use data received by the TRMM satellite when it flew above tropical storm HADI on March 10, 2014 at 0528 UTC. TRMM found that almost all heavy rainfall with HADI was located in the Coral Sea well off the northeastern coast of Australia. Data from TRMM's Precipitation Radar (PR) instrument were used in the image on the right to show the 3-D structure within the tropical storm. Tropical storm LUSI was located near

Tropical Storm Dylan (ELEVEN) Heads Toward Queensland

Tropical storm Dylan was heading from the Coral Sea toward Australia's Queensland coast when it was viewed by the TRMM satellite on January 30, 2014 at 0214 UTC. The rainfall analysis above used data collected by TRMM's Microwave Imager (TMI) and Precipitation Radar (PR) instruments. Rainfall is shown overlaid on an enhanced visible/infrared image from TRMM's Visible and InfraRed Scanner (VIRS). TRMM's TMI data revealed that moderate to heavy rain falling at a rate of over 31 mm/hr (about 1.2 inches) was preceding Dylan's movement toward the Australian coast. Dylan's approximate past and

Tropical Cyclone Alessia Soaks Northern Australia

During the past weekend tropical cyclone ALESSIA weakened to a tropical low as it moved from the Timor Sea over Northern Australia. The warm waters of the Gulf Of Capentaria have helped revive ALESSIA to tropical storm intensity today. The image on the right shows TRMM satellite data collected on November 27, 2013 at 0225 UTC. A 3-D perspective view (from the west) shows the tropical cyclone's vertical structure based on radar reflectivity data collected by TRMM's Precipitation Radar (PR) instrument. Thunderstorm towers are shown reaching heights above 16km (~9.92 miles) in a feeder band east

Zane Heading Towards Queensland Australia

Cyclone Zane, which as of 12:00 UTC (10:00 pm Australian Eastern Standard Time or AEST) 1 May 2013, was located about 215 km (~133 miles) due east of the coast of Queensland, Australia. TRMM captured this recent image of Cyclone Zane at 11:48 UTC (9:48 pm AEST) 1 May 2013. At the time, the center of circulation was located about 215 km (~133 miles) due east of the coast of Queensland, Australia and was heading west-northwest. TRMM reveals that Zane is still not very well organized with no eye visible and very little evidence of banding (curvature) in the rain area. At the time of this image

Tropical Cyclone Rusty's Flooding Rainfall

In addition to high winds tropical cyclone Rusty's heavy rainfall caused flooding in north-western Australia. The TRMM satellite's main purpose is the accurate measurement of tropical rainfall around the globe. TRMM is also used to calibrate rainfall estimates from other satellites. The TRMM-based, near-real time Multi-satellite Precipitation Analysis (TMPA) at the NASA Goddard Space Flight Center provides estimates of rainfall over the global Tropics. TMPA rainfall totals in association with tropical cyclone Rusty are shown for the period from February 21-28, 2013. Rusty's approximate 0000Z

Tropical Cyclone Rusty Moves Into Australia

On February 27, 2013 at 0559 UTC The TRMM satellite again saw tropical cyclone Rusty moving toward Australia's coastline north-west of Hedland. A rainfall analysis derived from TRMM's Microwave Imager (TMI) data is shown overlaid on a visible/infrared image from the TRMM Visible and InfraRed Scanner (VIRS). Rusty's eye, surrounded by light to moderate rainfall, was revealed by TRMM's TMI data to be located very near the coastline. Click here to see an animation which fades from the underlying visible/infrared image to the TMI rainfall analysis image. Tropical cyclone Rusty is predicted to

Extreme Rainfall Causes Flooding Over Eastern Australia

A large area of low pressure from the remnants of tropical storm Oswald has caused additional extremely heavy rainfall as it moved southward over eastern Australia. This deluge has caused flooding in areas from the Cape York Peninsula to the Queensland state capital, Brisbane. At least four deaths have been attributed to the high winds and flooding associated with this low pressure system. This image shows a TRMM calibrated Multi-satellite Precipitation Analysis (MPA) for the period from January 21-28, 2013. This analysis shows that tropical cyclone Oswald dumped over 600mm (~23.6 inches) of