Australia

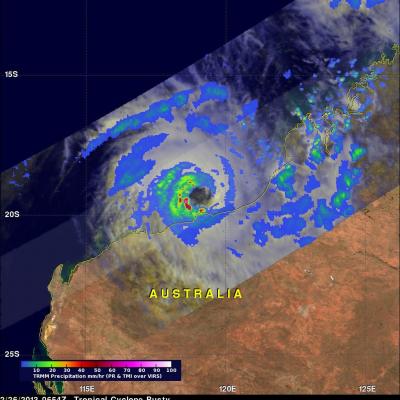
Tropical Cyclone Rusty Heading For Australia

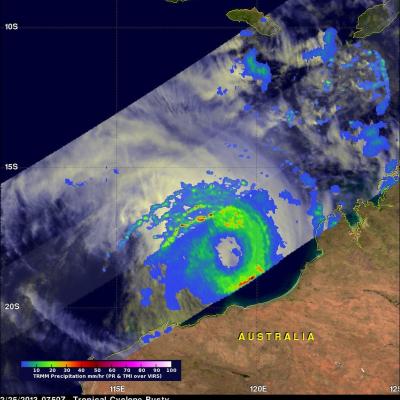
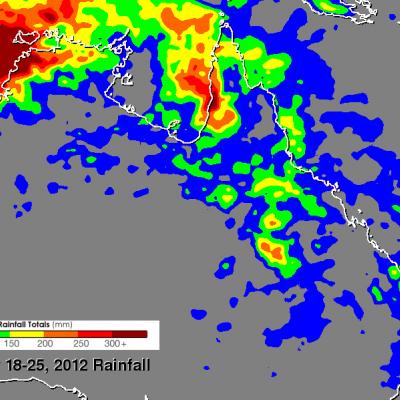
A tropical cyclone called Rusty developed in the Indian Ocean north of north-western Australia's coast on February 24, 2013. The TRMM satellite viewed the intensifying tropical cyclone when it flew over on February 25, 2013 at 0750 UTC. A rainfall analysis from TRMM's Microwave Imager (TMI) and Precipitation Radar (PR) with that orbit is shown overlaid on a visible/infrared image from TRMM's Visible and InfraRed Scanner (VIRS). This analysis showed that Rusty had an extensive area of rainfall surrounding Rusty's very large eye. TRMM PR and TMI instruments found that rain within wide bands of

Powerful Rusty At Australia's Door

Tropical cyclone Rusty's winds had increased to hurricane intensity when the TRMM satellite flew directly above on February 26, 2013 at 0654 UTC. A rainfall analysis derived from TRMM data is shown with the first image. Rain rates in the center of the swath are from the TRMM PR, while those in the outer swath are from the TRMM Microwave Imager (TMI). The rain rates are overlaid on a combination infrared (IR) visible (vis) image derived from the TRMM Visible Infrared Scanner (VIRS). TRMM PR found that the heaviest surface rain was coming down at a rate of over 138mm/hr (~5.4 inches). This

TRMM Sees Tropical Cyclone 19S

Tropical cyclones are more likely to form in the northern hemisphere in May so tropical cyclone 19S is a little unusual. Tropical cyclone 19S attained tropical storm intensity in the Banda Sea on 7 May 2012. 19S is expected to quickly weaken to tropical depression intensity with wind speeds of about 25 kts (~29 mph) as it moves southward into the Timor Sea north of Australia. The TRMM satellite has been useful for monitoring the development of tropical cyclones over the global tropics. TRMM flew above tropical cyclone 19S during the daylight on 8 May 2012 at 0213 UTC. A rainfall analysis from

Record Rainfall Continues Over Australia

Over the past month northeastern Australia has continued to receive record rainfall from the monsoon trough that has been draped over that area. The Australian Bureau of Meteorology has indicated that some recorded rainfall rates are seen only once in 100 years. Flooding rainfall amounts have been especially extreme near the coasts of northeastern Australia. For increased coverage, TRMM data can be used to calibrate rainfall estimates from other satellites. The TRMM-based, near-real time Multi-satellite Precipitation Analysis (TMPA) at the NASA Goddard Space Flight Center is used to monitor

TRMM Sees Tropical Storm Lua's Formation

A tropical storm called LUA formed in the Indian Ocean off Australia's northwestern coast on 13 March 2012. This area of Australia is sparsely populated but LUA caused the shutdown of over one quarter of the country's crude oil production. The TRMM satellite flew over this area on 13 March 2012 at 1622 UTC. A Rainfall analysis using TRMM's Microwave Imager (TMI) and Precipitation Radar (PR) instruments is shown overlaid on an enhanced infrared image from TRMM's Visible and InfraRed Scanner (VIRS). This analysis indicates that rainfall intensity was mainly in the moderate range of 20 to 30 mm

Monsoon Trough Continues to Drench Northeastern Australia

Low pressure centers associated with a summer monsoon trough have repeatedly drenched Australia from central Queensland to northern New South Wales. The clockwise rotation of these low pressure centers have continued to pump warm moist air from the Coral Sea over these areas resulting in severe flooding. Thousands of Australians have been displaced by this flooding. The current La Nina conditions are predicted to continue causing heavy rainfall over northeastern Australia. Data from the TRMM satellite are used to calibrate rainfall data merged from various satellite sources. This TRMM-based

Iggy Rainfall Hits Australia

On 2 February 2012 at 1044 UTC the TRMM satellite again saw weakening tropical storm IGGY as it was approaching the coast of southwestern Australia. Data from TRMM's Microwave Imager (TMI) and Precipitation Radar (PR) instruments showed that bands of heavy rainfall measuring over 50mm/hr (~2 inches) were hitting coastal areas northwest of Perth, Australia. A red tropical storm symbol shows where Iggy's center was located.

Tropical Cyclone Iggy

The TRMM satellite passed above tropical storm Iggy on 1 February 2012 at 0647 UTC as the storm was heading toward the coast of southwestern Australia. Iggy was briefly categorized as a category 1 tropical cyclone on the Saffir-Simpson scale but is predicted to be a weak tropical storm with winds of about 35kts (~40 mph) when it moves over the Australian coast. Iggy's past and forecast locations are shown with appropriate white tropical cyclone symbols on the image above. TRMM data revealed that Iggy had a large area of moderate to heavy rainfall south of the center of circulation. TRMM's

Monsoon brings Heavy Rain to Parts of Australia

Thousands of people were asked to evacuate recently as parts of northern and eastern Australia felt the effects of heavy rains brought about by the summer monsoon. Though not expected to be as bad as last year, when dozens of people were killed and tens of thousands of homes were flooded, the recent heavy rains have led to flash flooding and landslides in Queensland and caused rivers to overflow their banks in New South Wales. The monsoon plays a prominent role in the annual rainfall cycle over Australia. A monsoon is a seasonal phenomenon wherein an area of low pressure forms over a large
TRMM Sees Tropical Storm Heidi JacobAdmin Thu, 01/12/2012
On 10 January 2012 at 1544 UTC the TRMM satellite passed above tropical storm Heidi as it was forming off the northwestern coast of Australia. Heidi is the first named tropical cyclone to hit Australia this season. An analysis of rainfall from TRMM Microwave Imager (TMI) and Precipitation Radar (PR) data is shown above. This analysis shows that Heidi was starting to get organized with bands of heavy convective rainfall spiraling toward the center of the storm. Heidi was dropping rainfall at a rate of over 50mm/hr (~2 inches) in some areas. A 3-D image above was made from TRMM PR data. It shows