GPM Sees Hurricane Matthew Producing Dangerous Rainfall
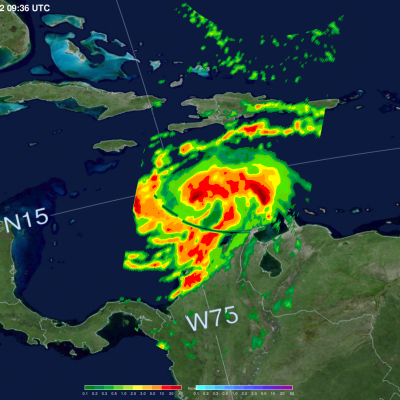
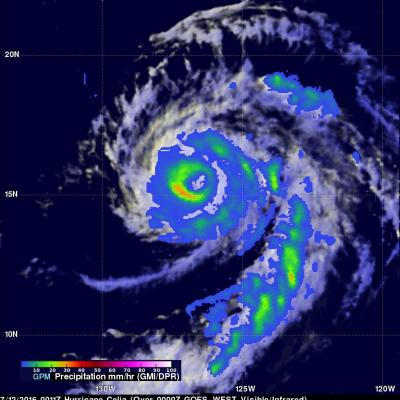
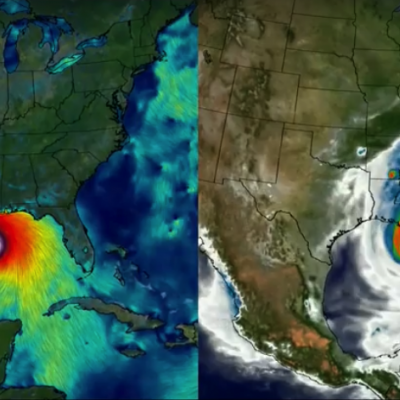
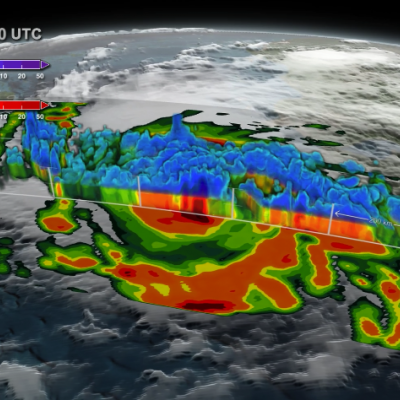
The GPM core observatory satellite passed above hurricane Matthew on October 2, 2016 at 5:46 AM EDT (0946 UTC). GPM’s Microwave Imager (GMI) and Dual-Frequency Precipitation Radar (DPR) instruments collected data that were used in the rainfall map shown here. GPM found that very heavy rainfall was located around Matthew. Rain was revealed by GPM falling at a rate of over 6.4 inches (163 mm) in some areas near hurricane Matthew. Of particular interest is an area of very heavy rain located well to the east of Hurricane Matthew’s center. This blob of strong convective storms has been persistent